Milano Digital Week 2026 · STEP FuturAbility District
Zathura
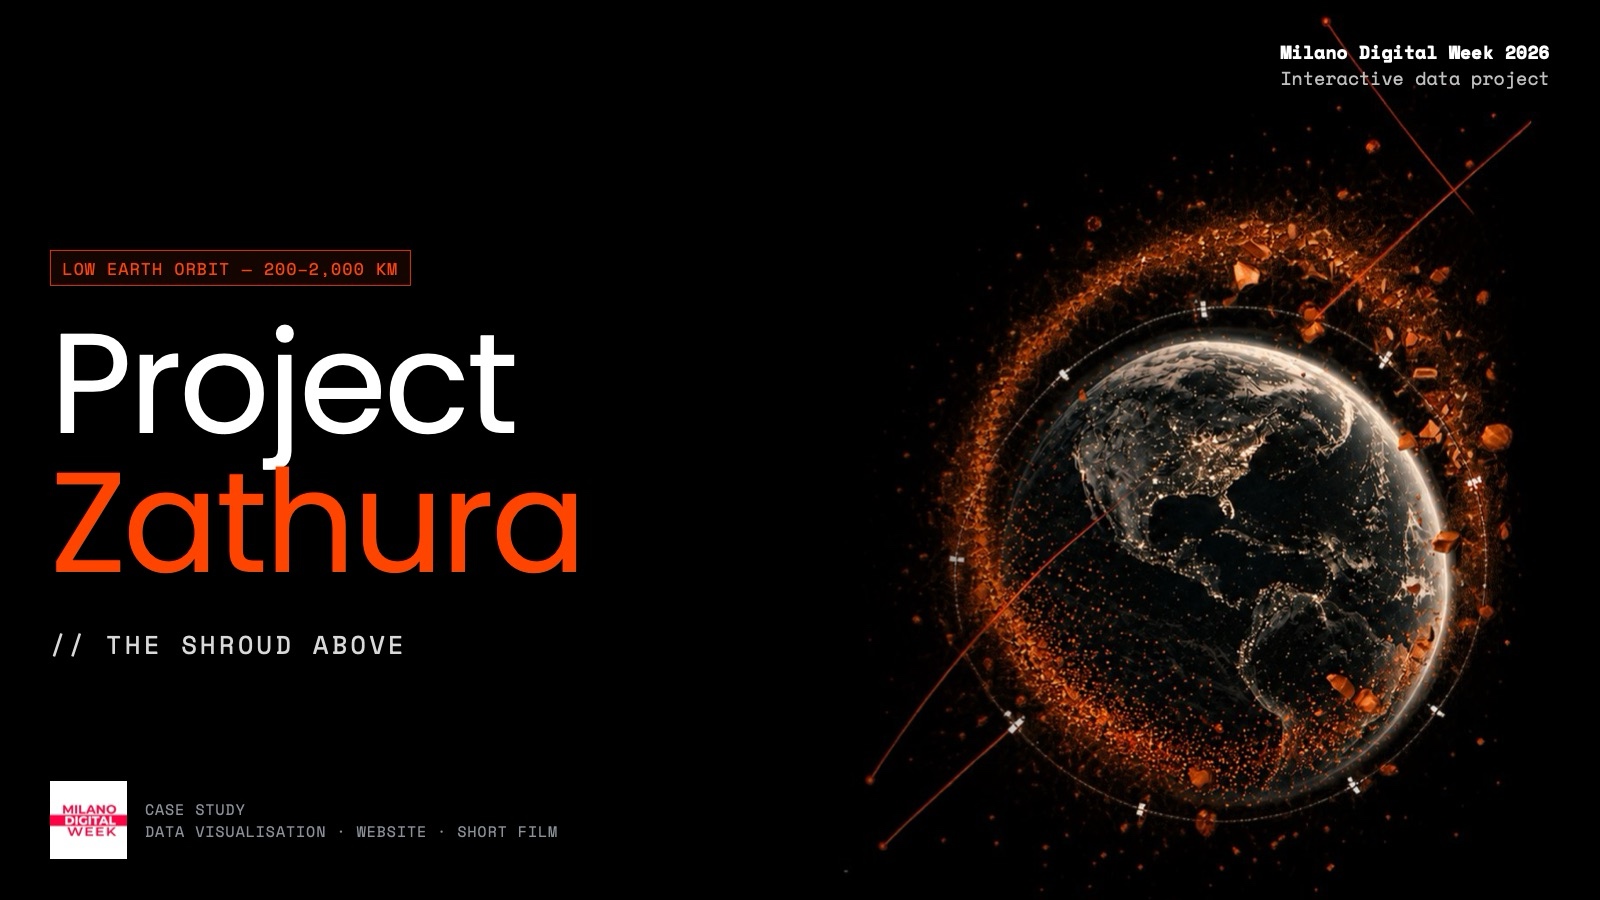
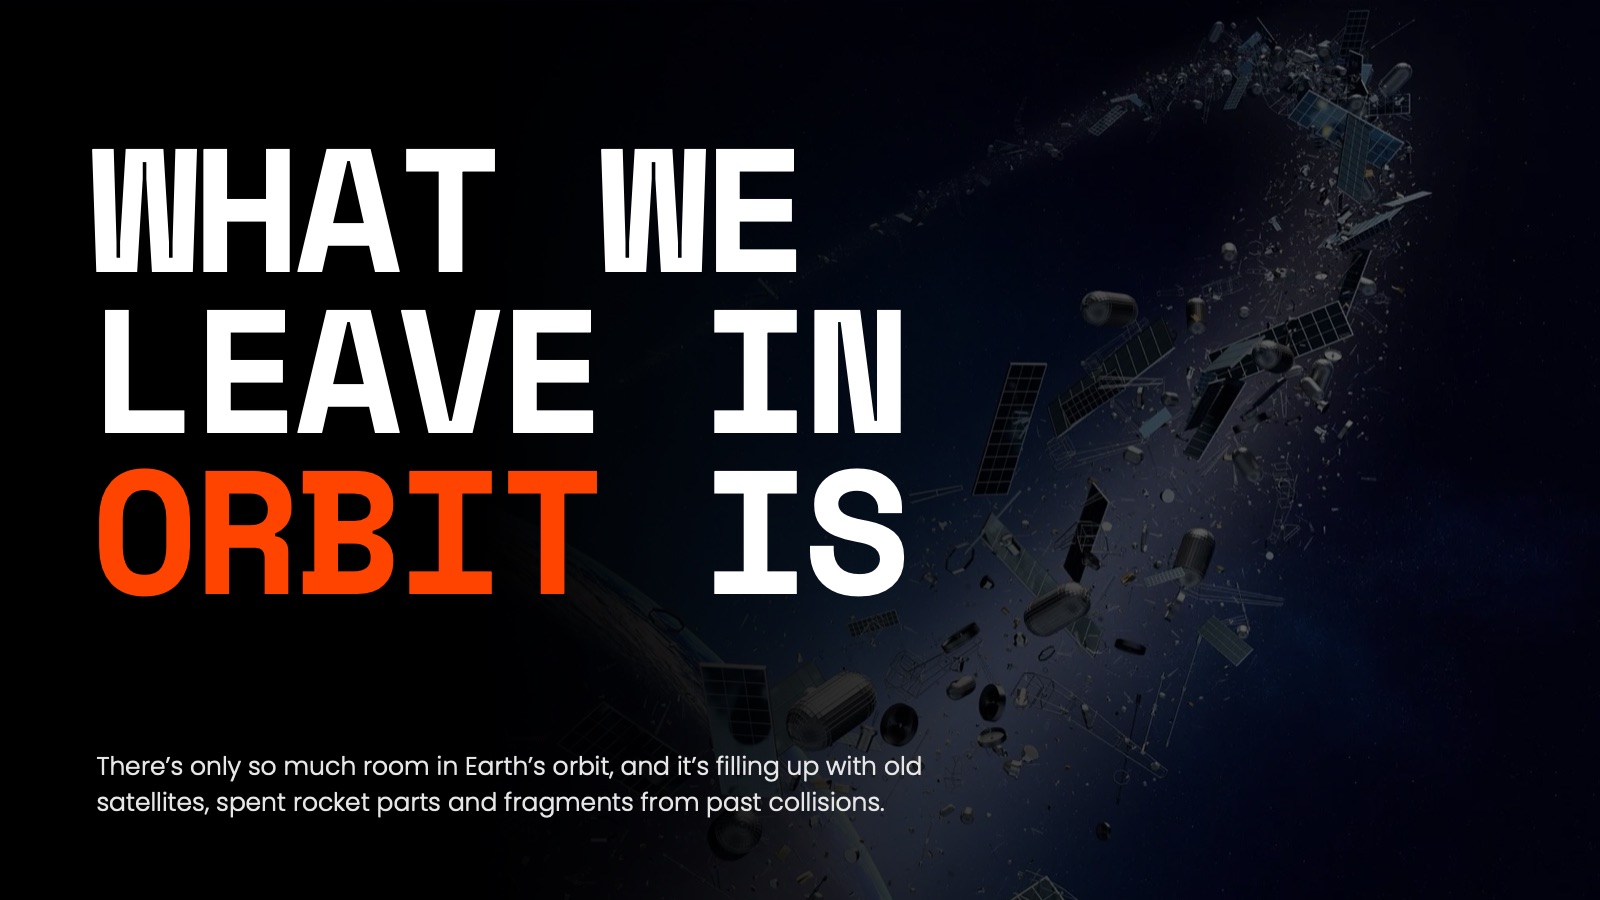
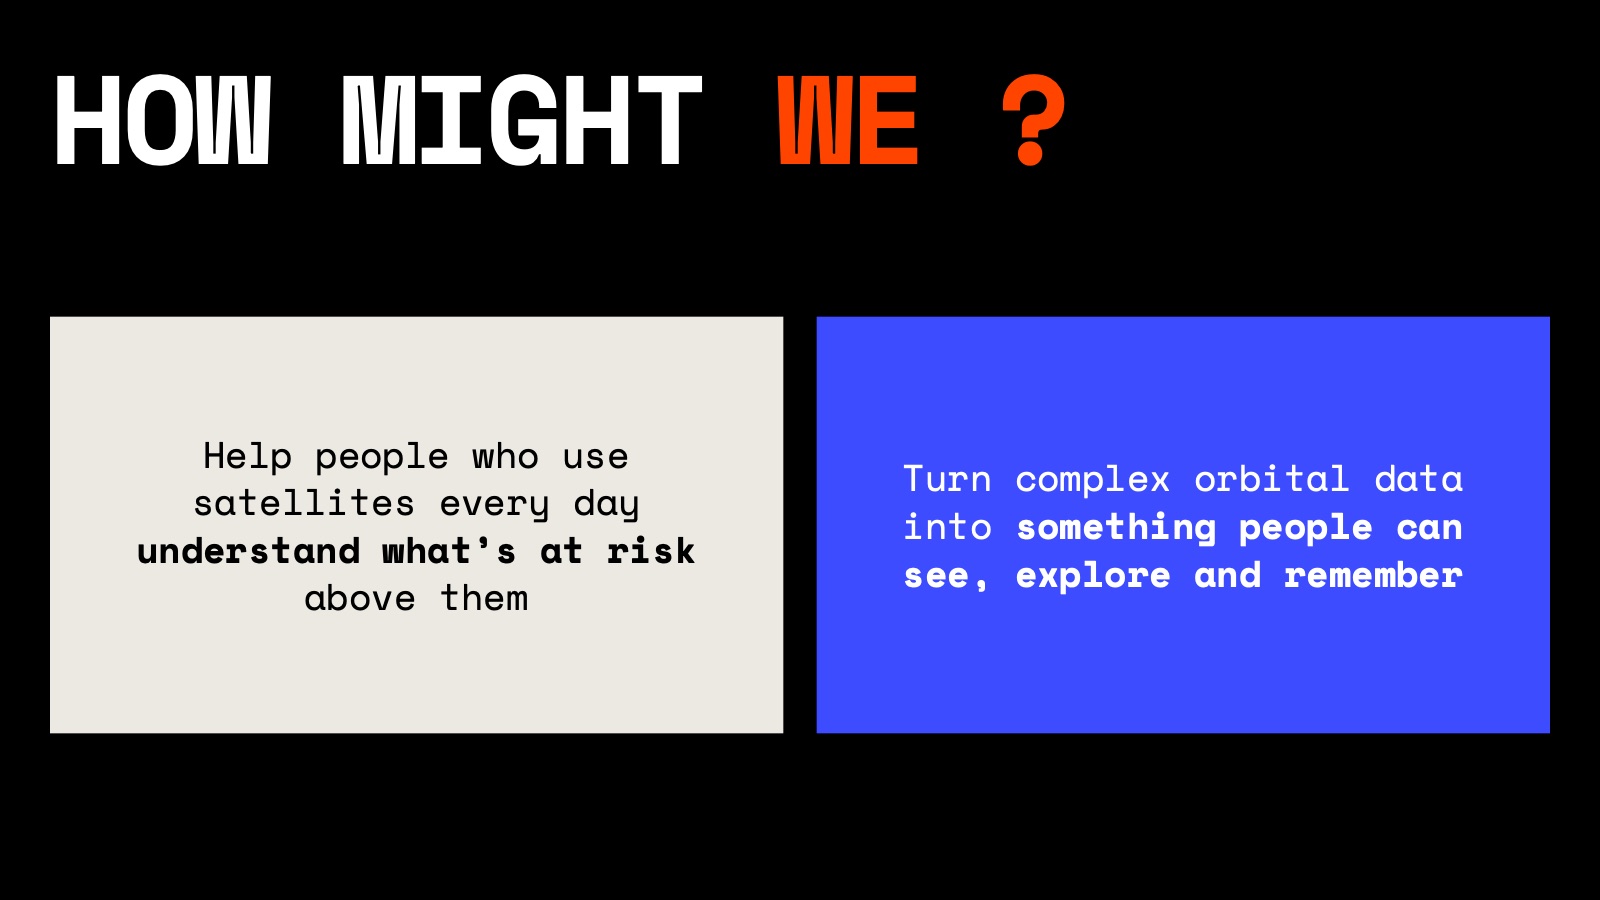
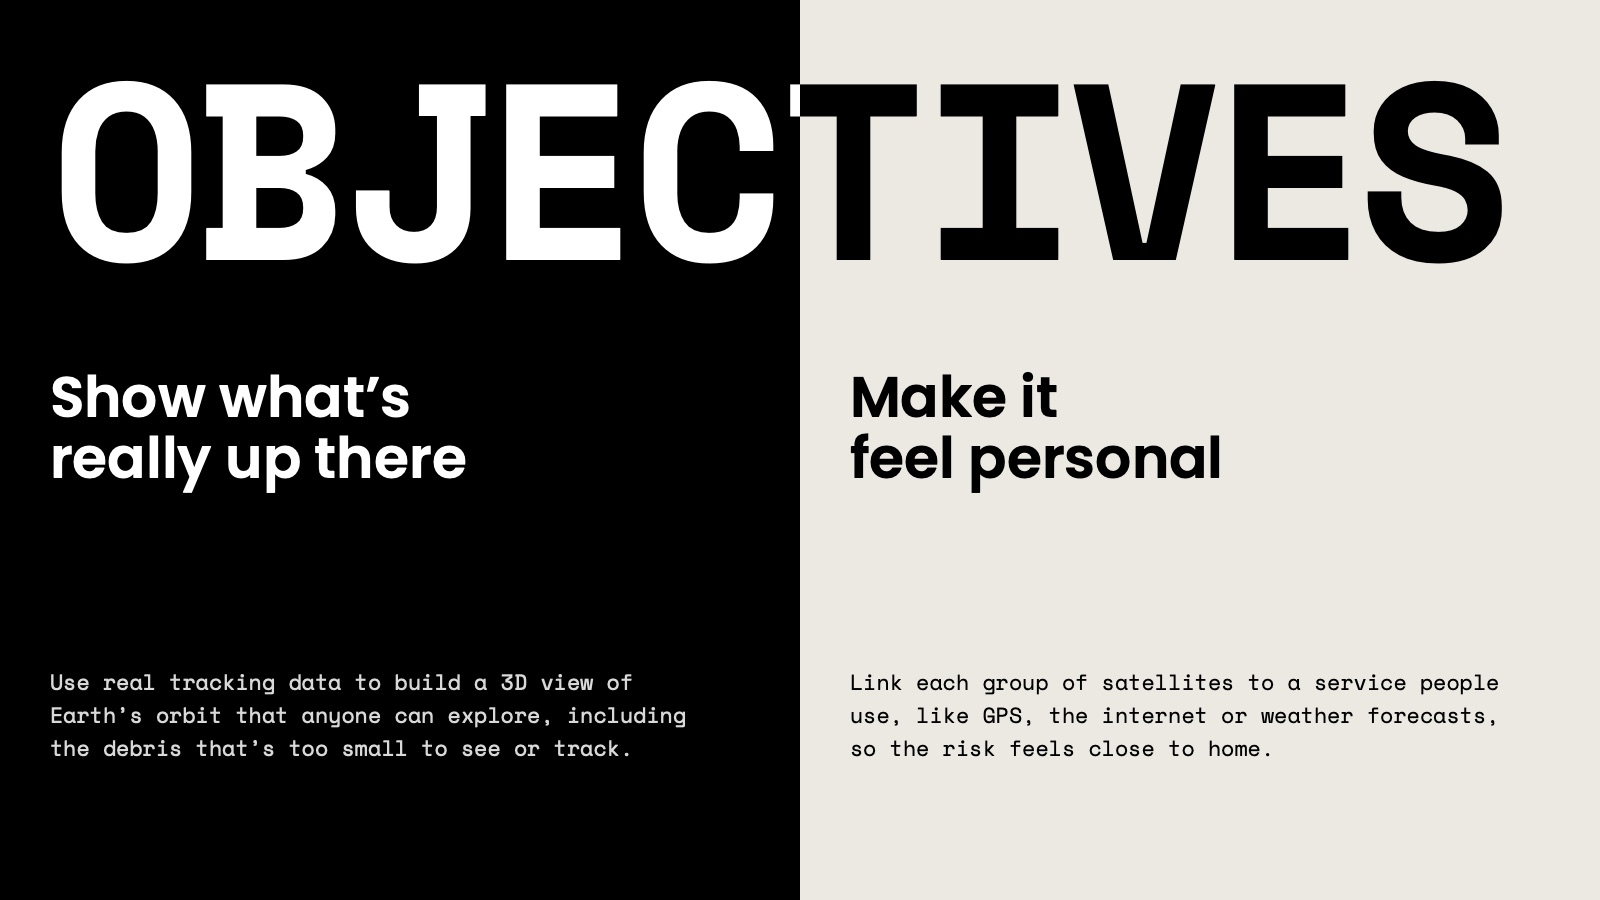
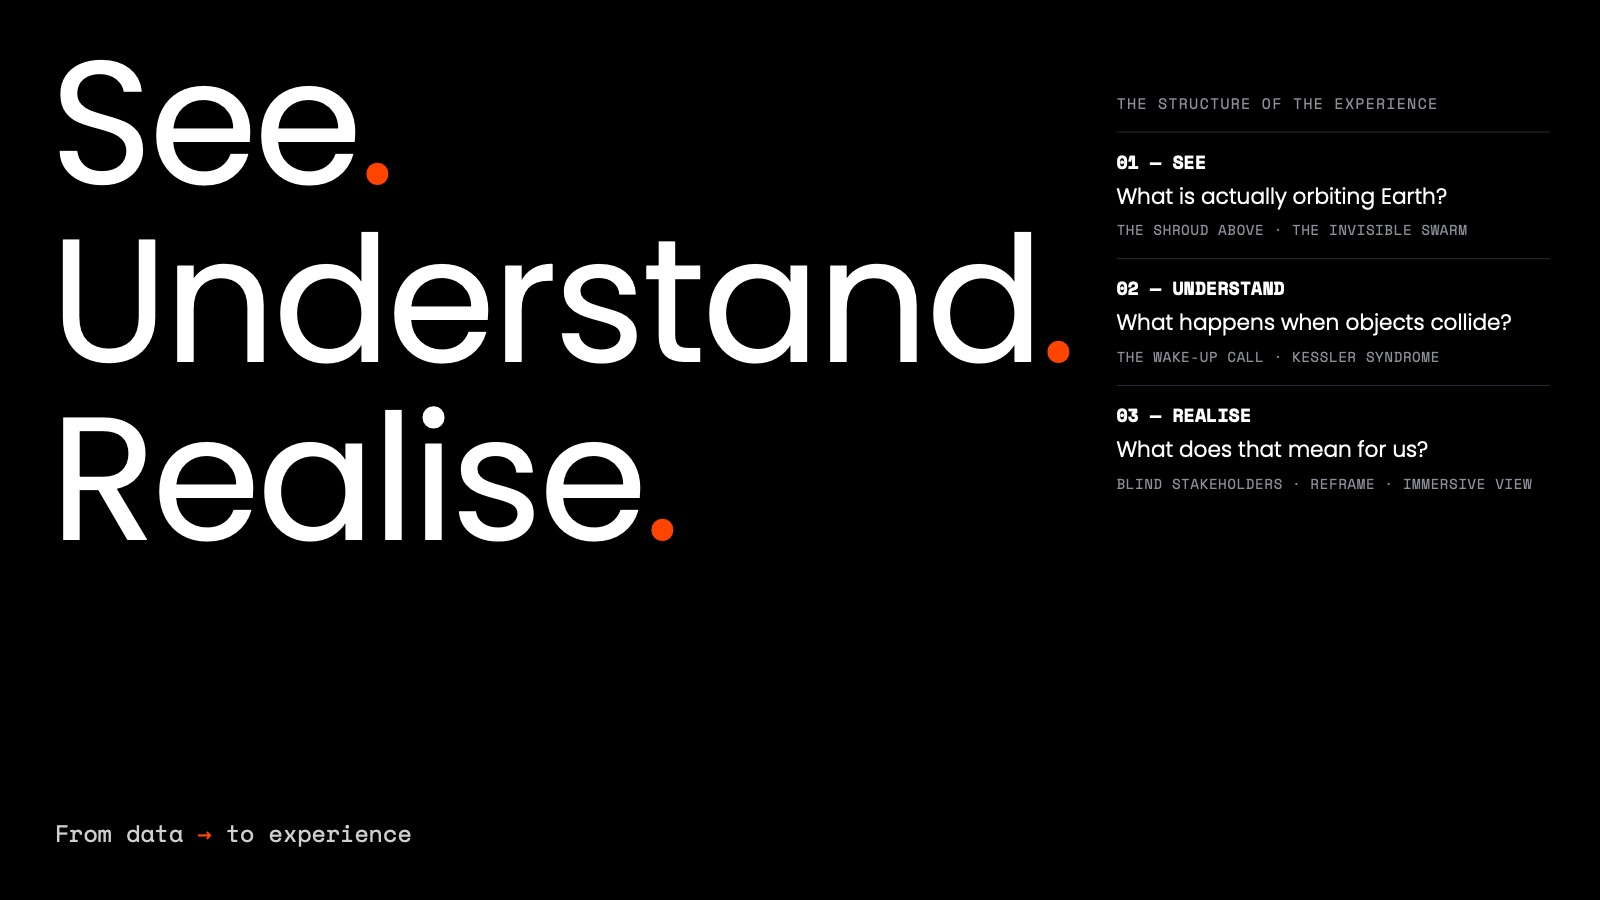
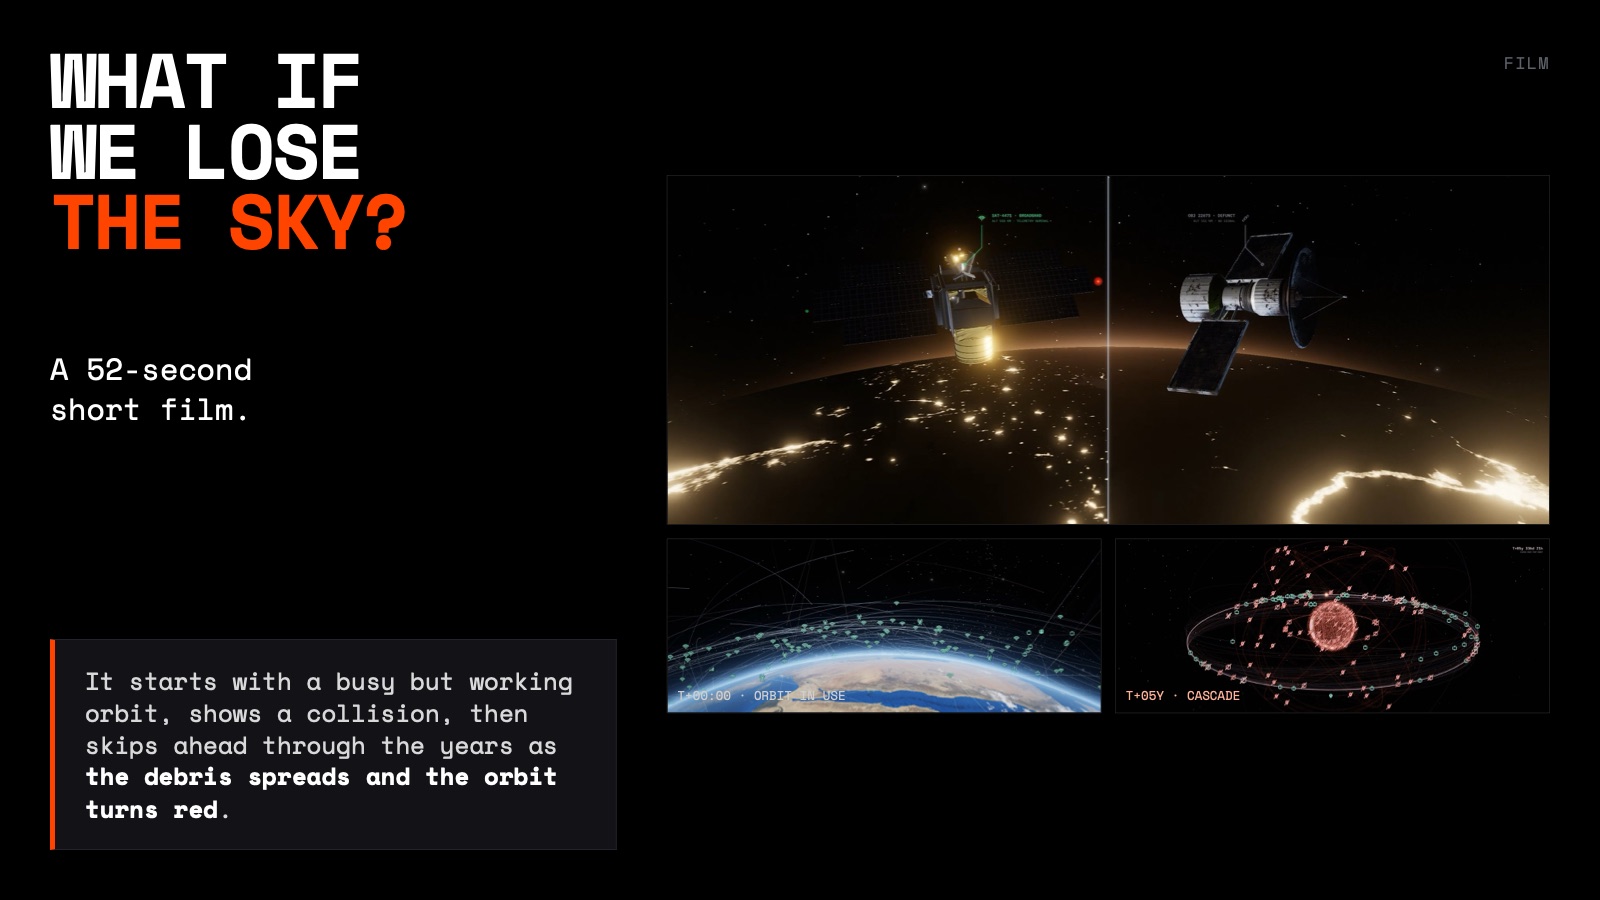
An interactive journey through Earth’s increasingly crowded orbit — a data visualisation, website and short film about the debris we leave in space, and why it matters down here.
- My role
- Project lead — UX research, website design & build, data visualisation, sound design
- Format
- Interactive website · Data visualisation · Short film
- Live site
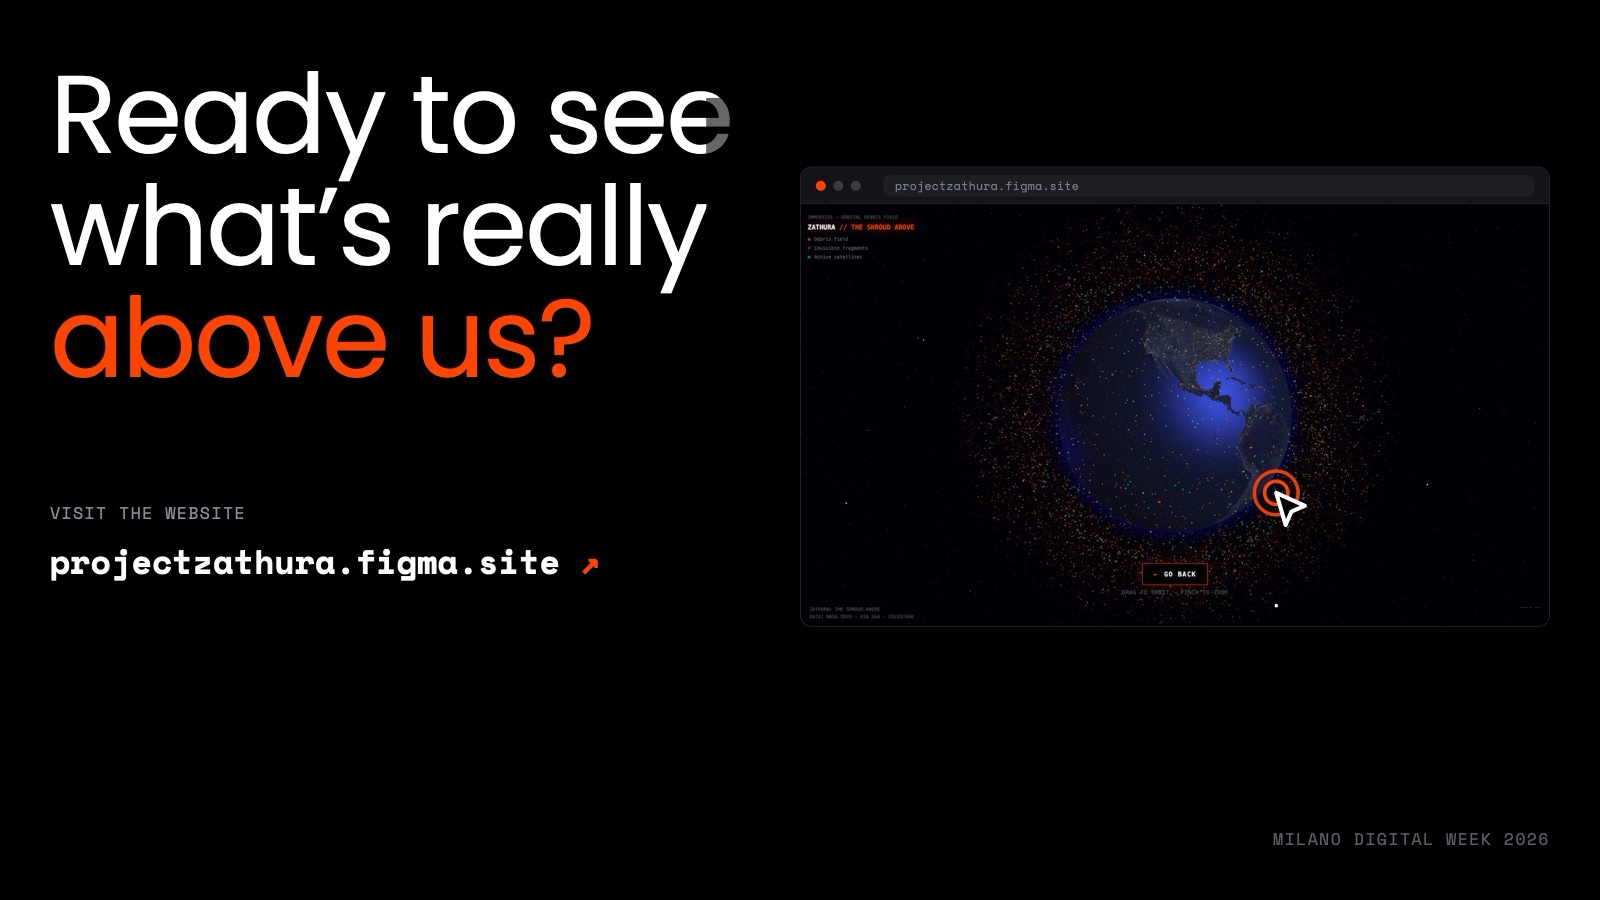
- projectzathura.figma.site ↗
Case study
Milano Digital Week
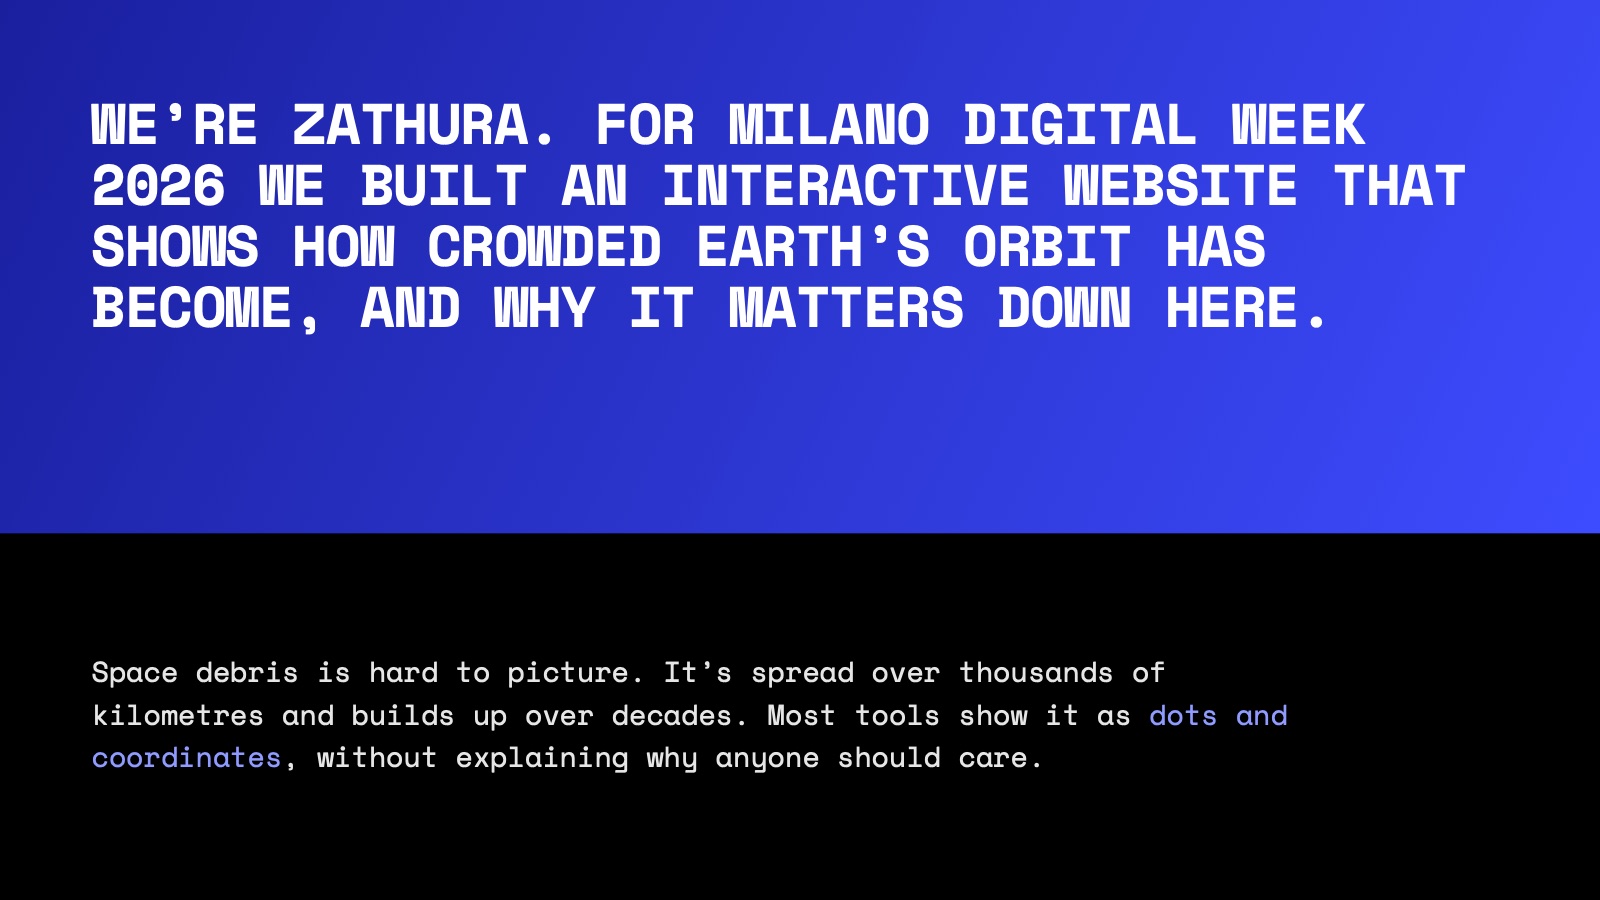
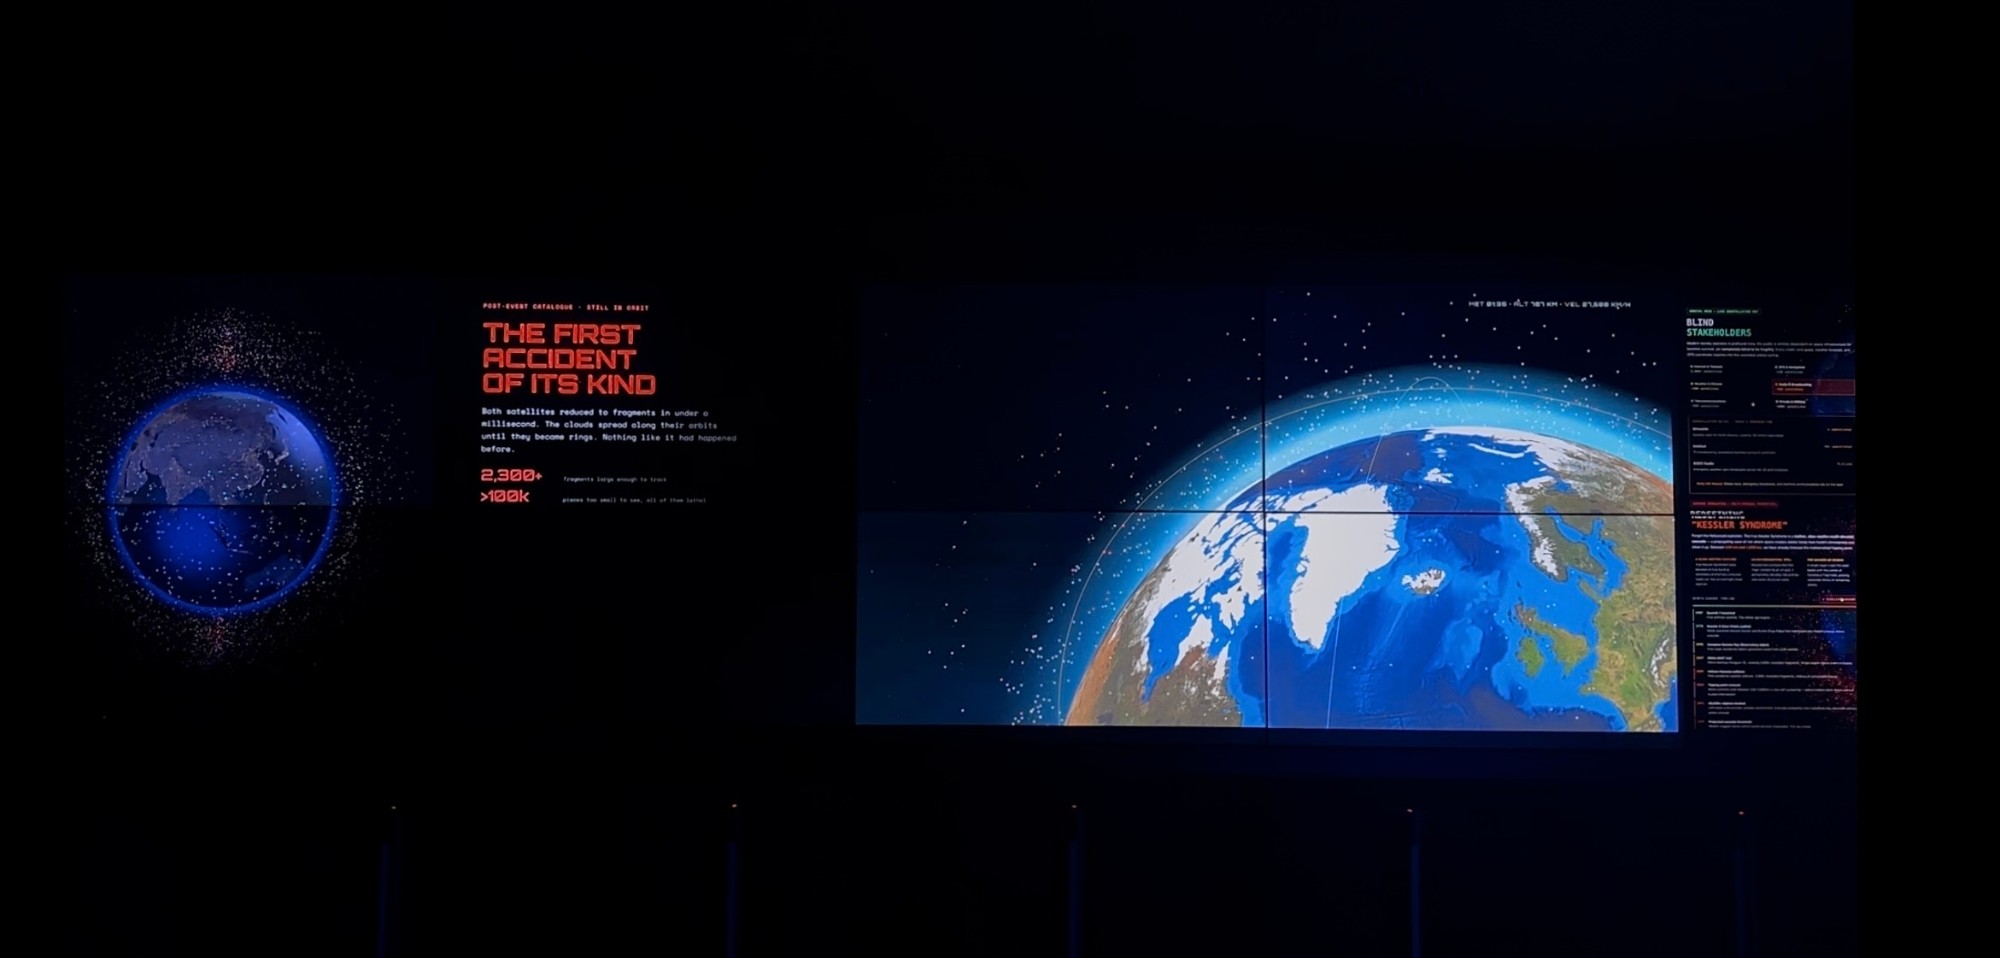
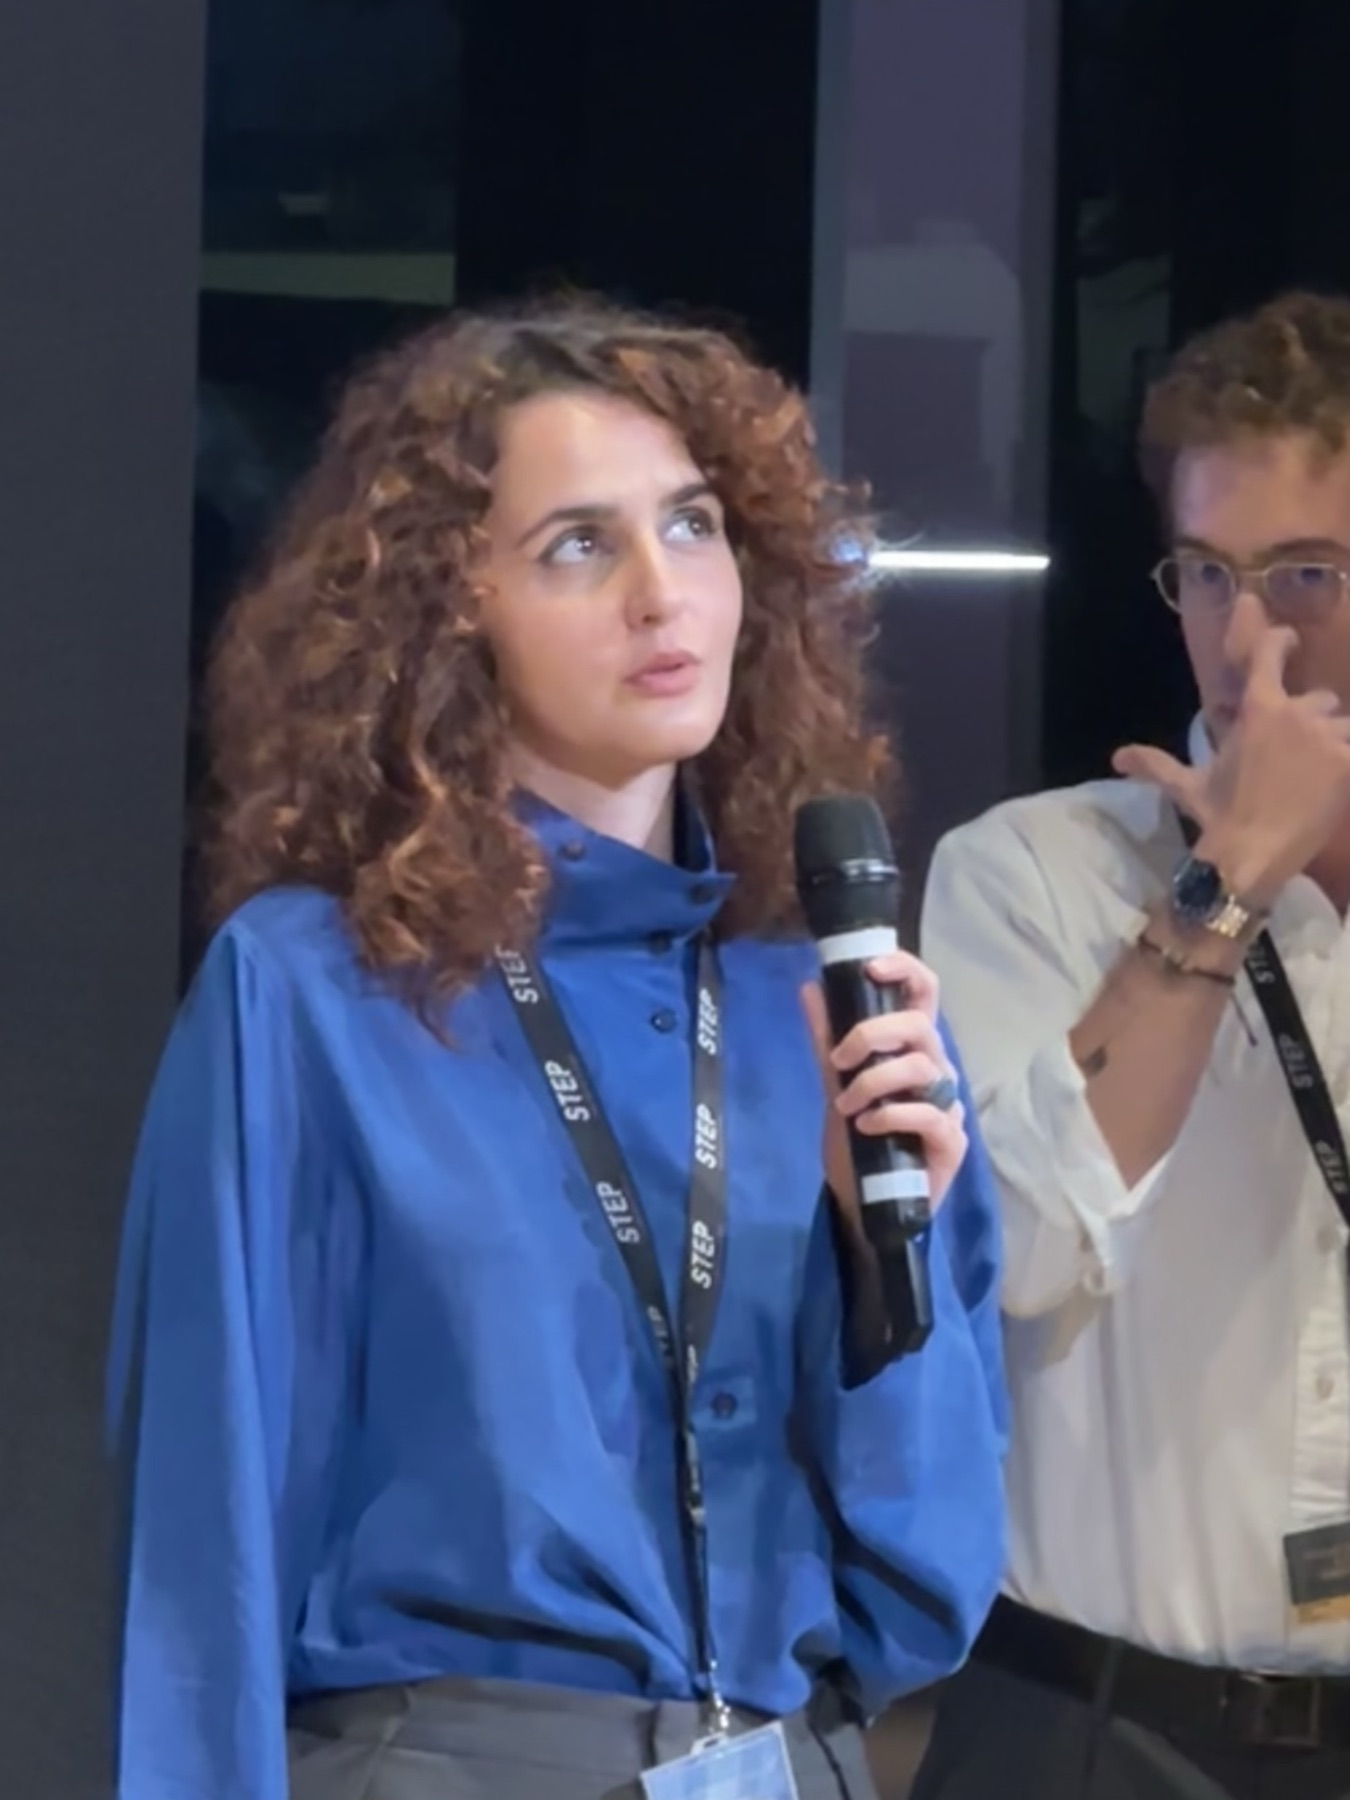
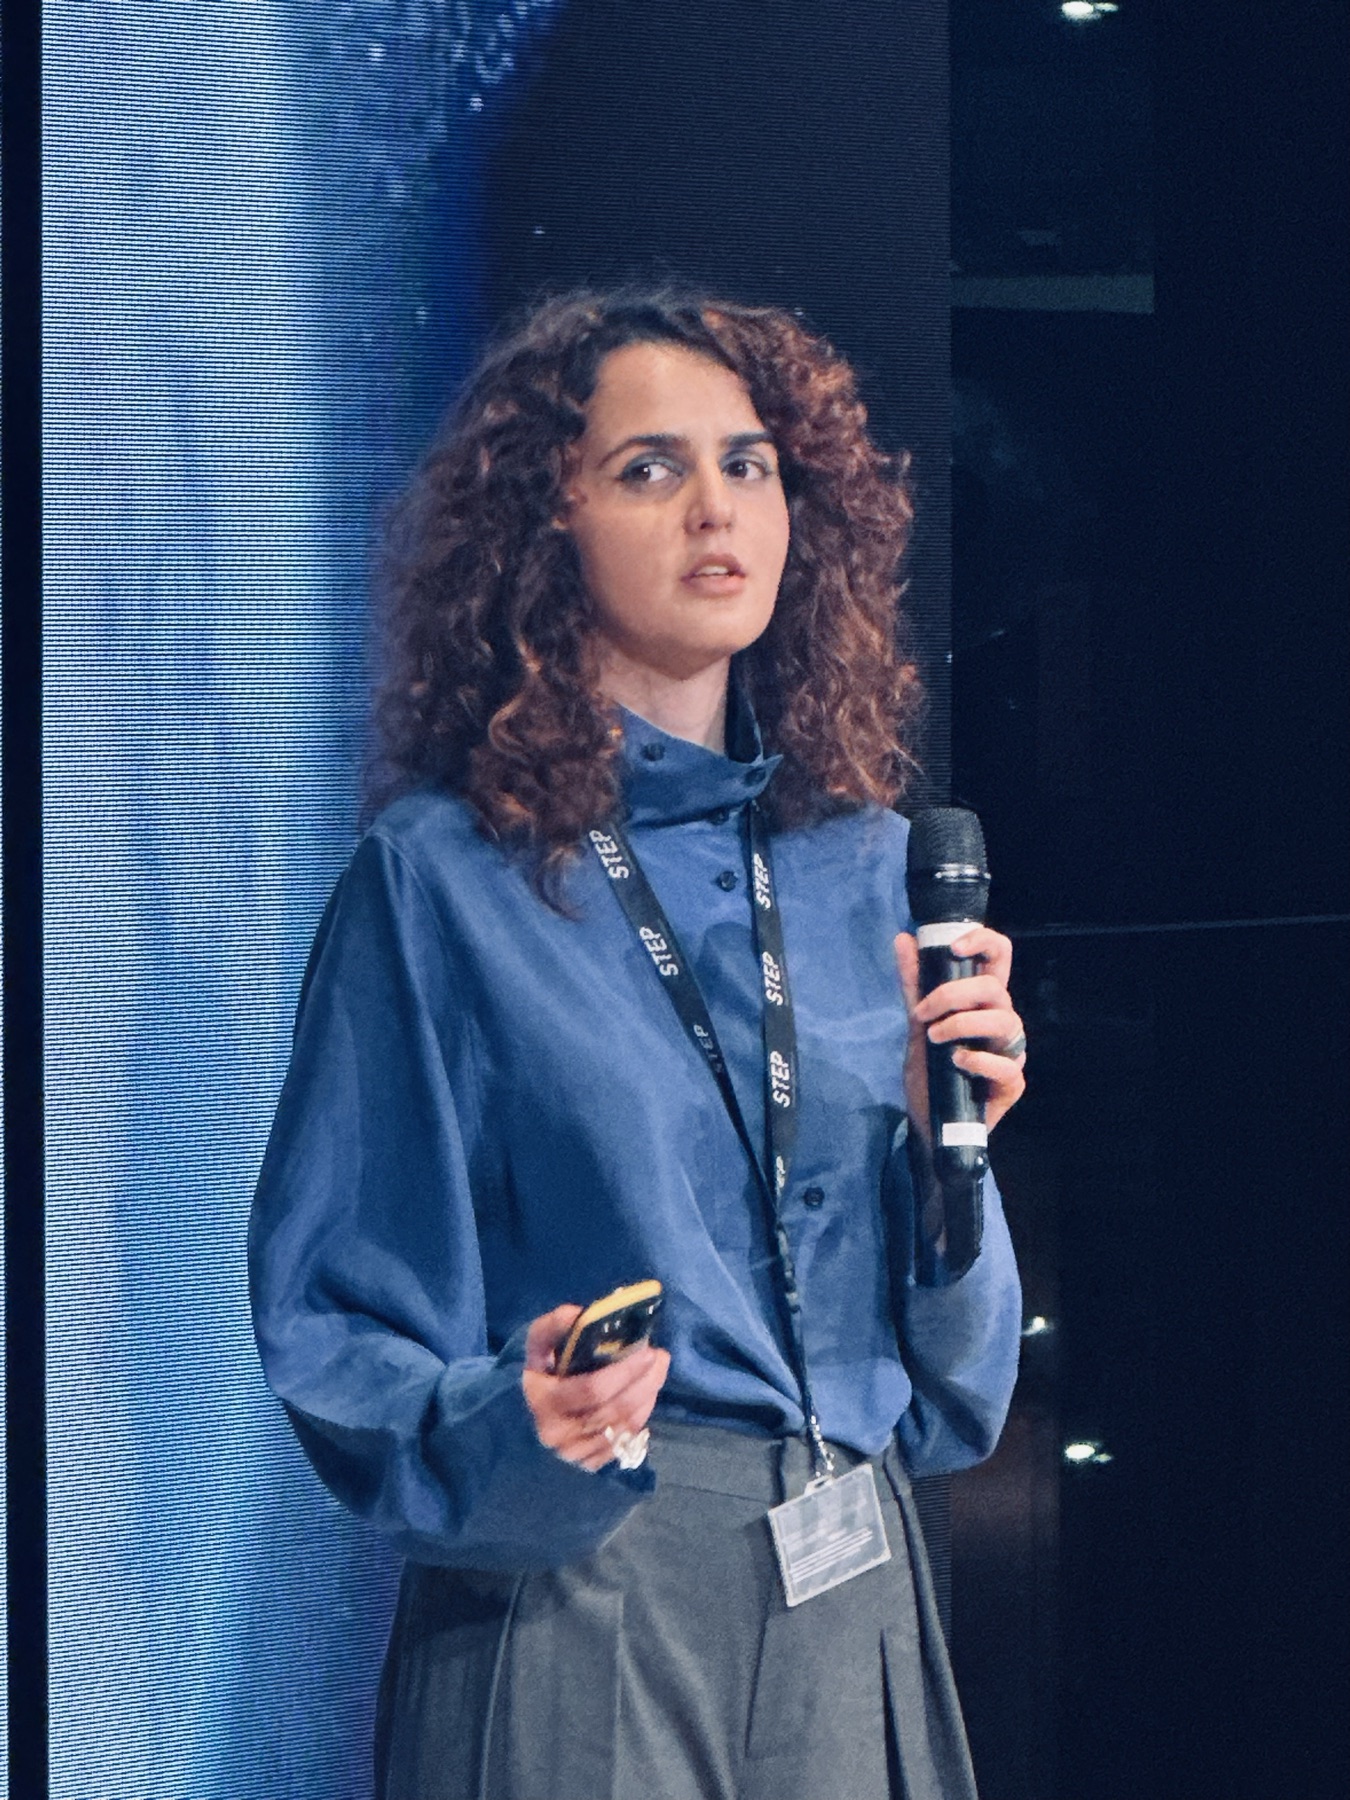
Milano Digital Week is Milan’s yearly festival of digital culture. For the 2026 edition we brought Zathura to STEP FuturAbility District and gave it a whole wall.
What we presented
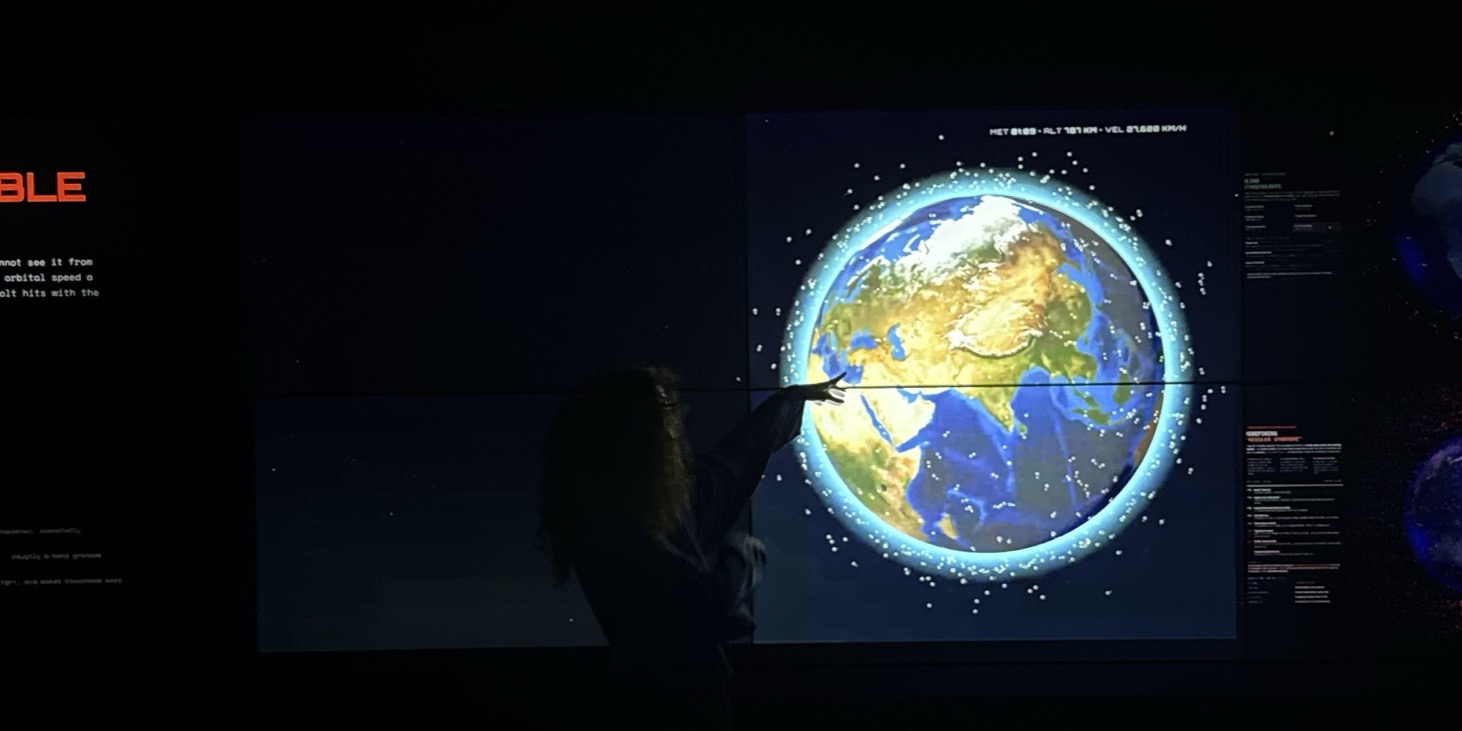
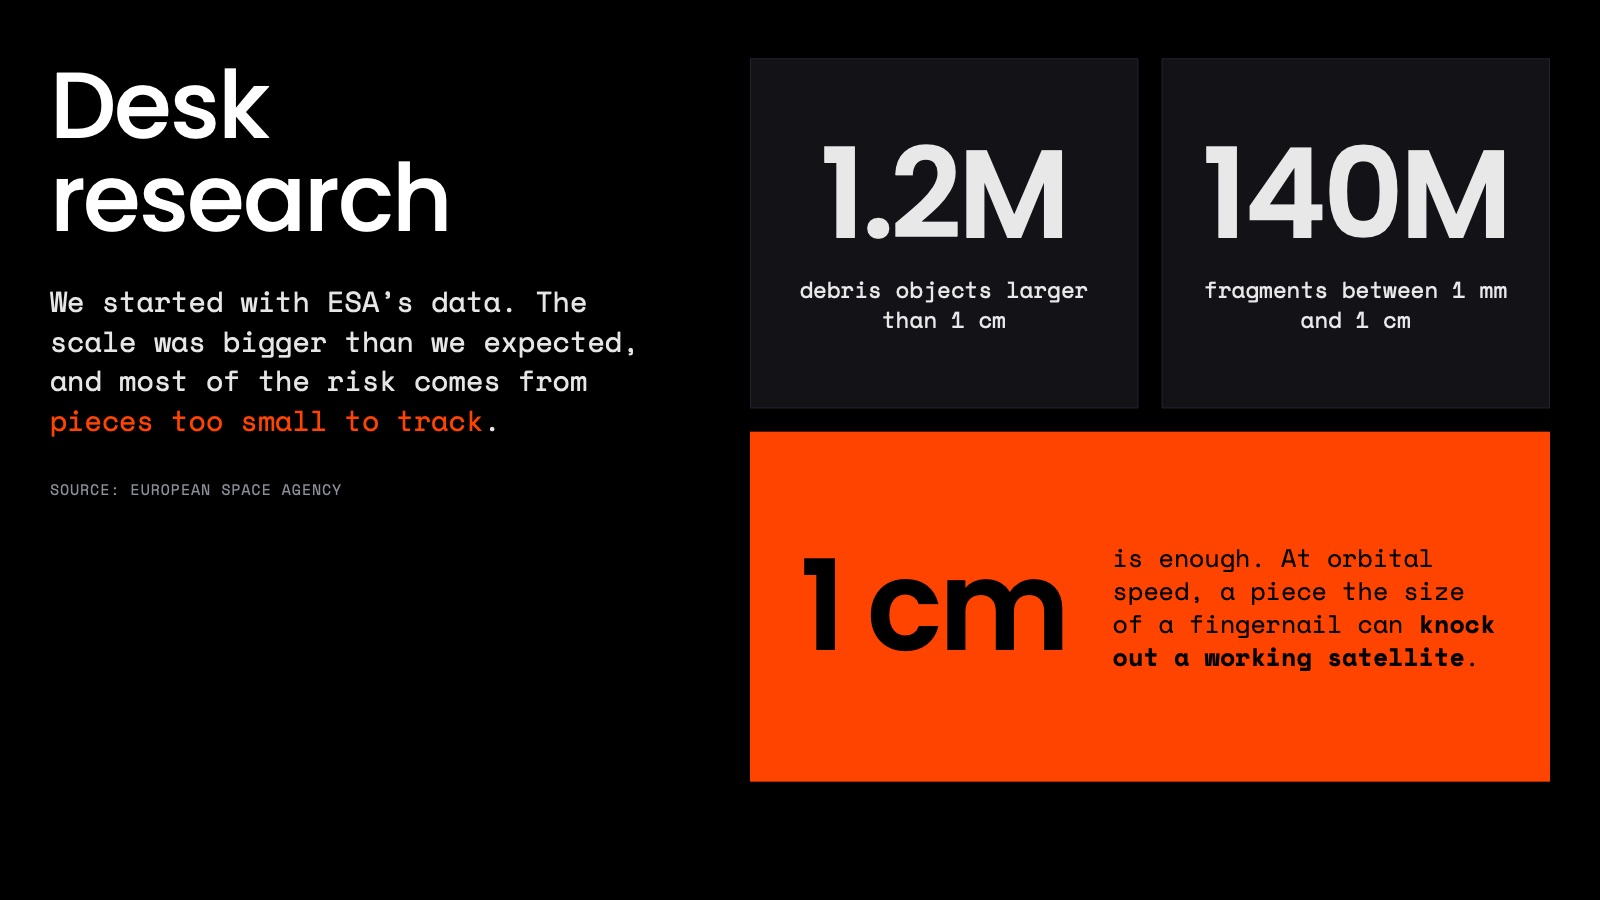
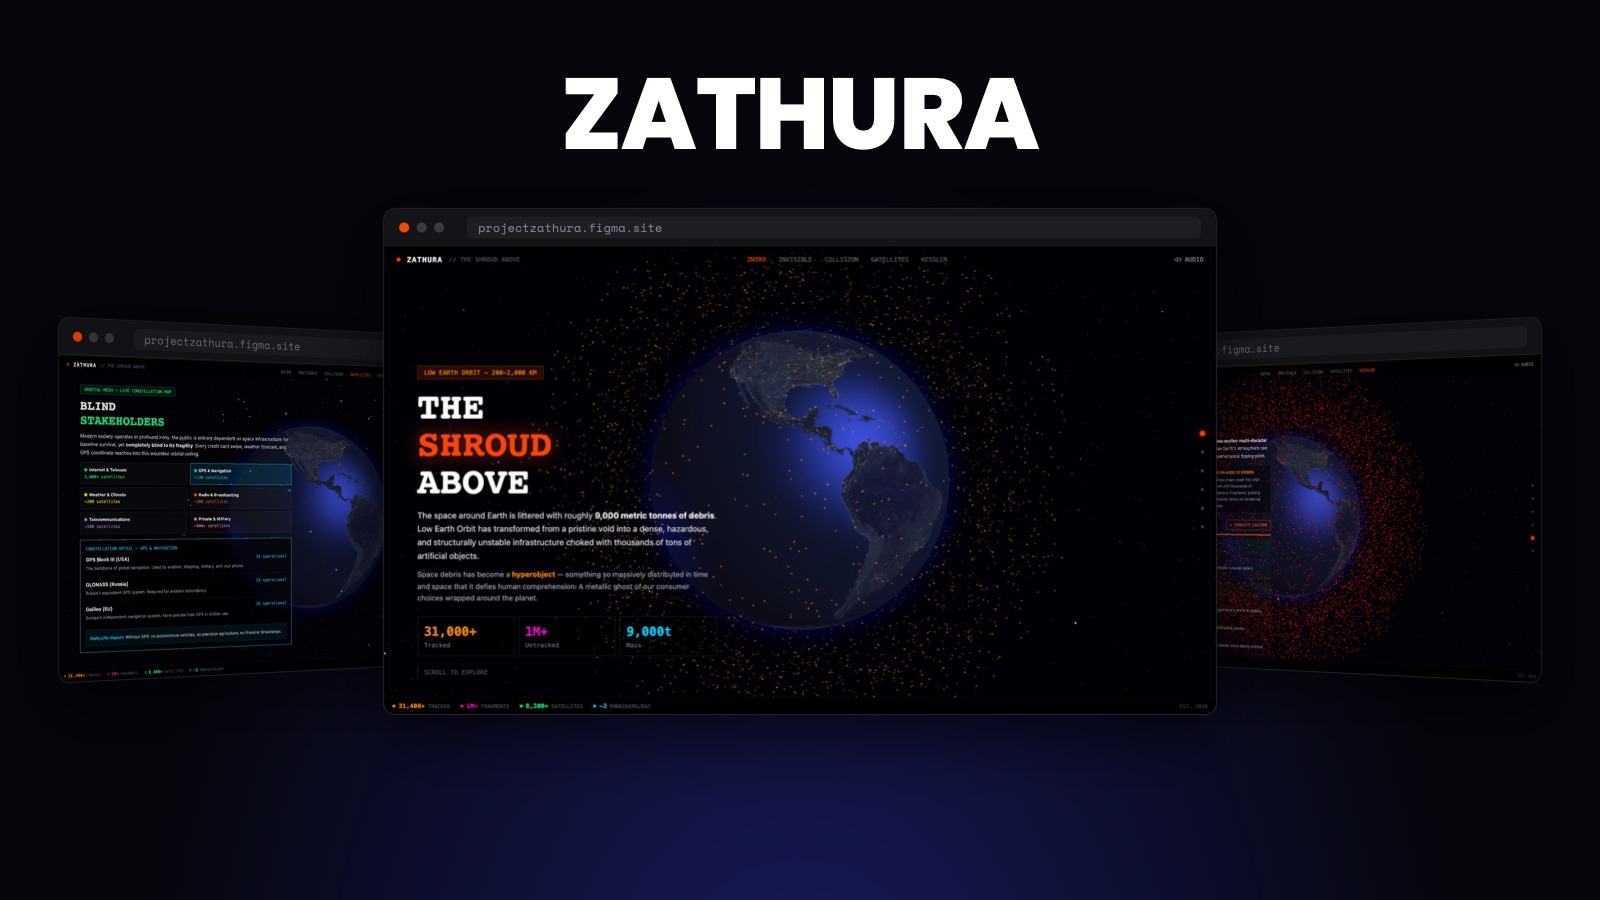
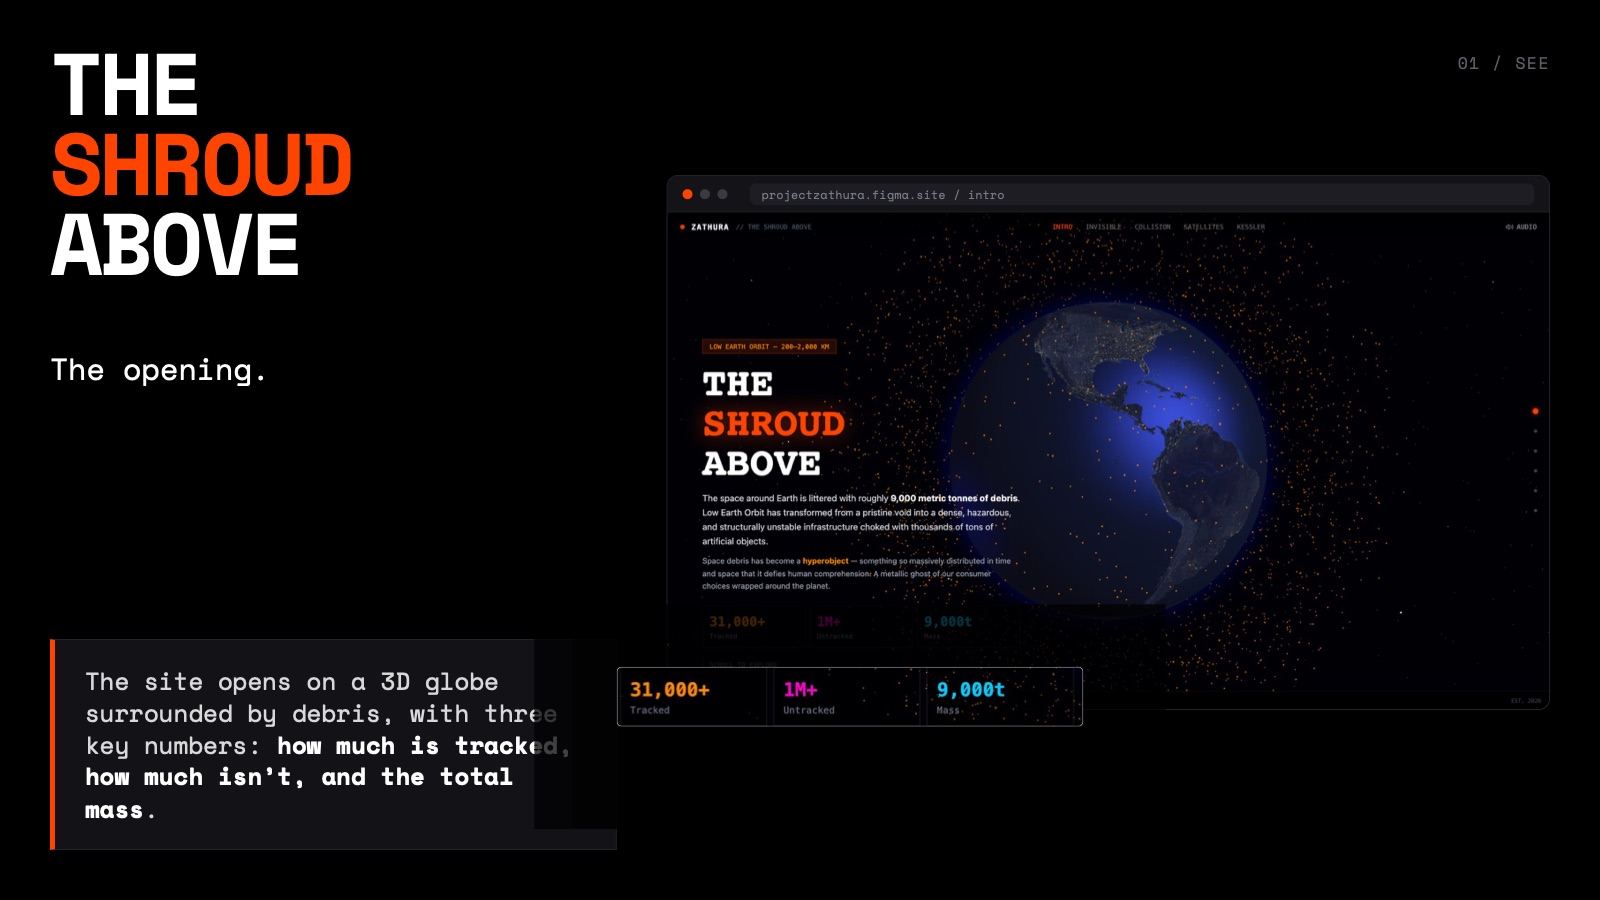
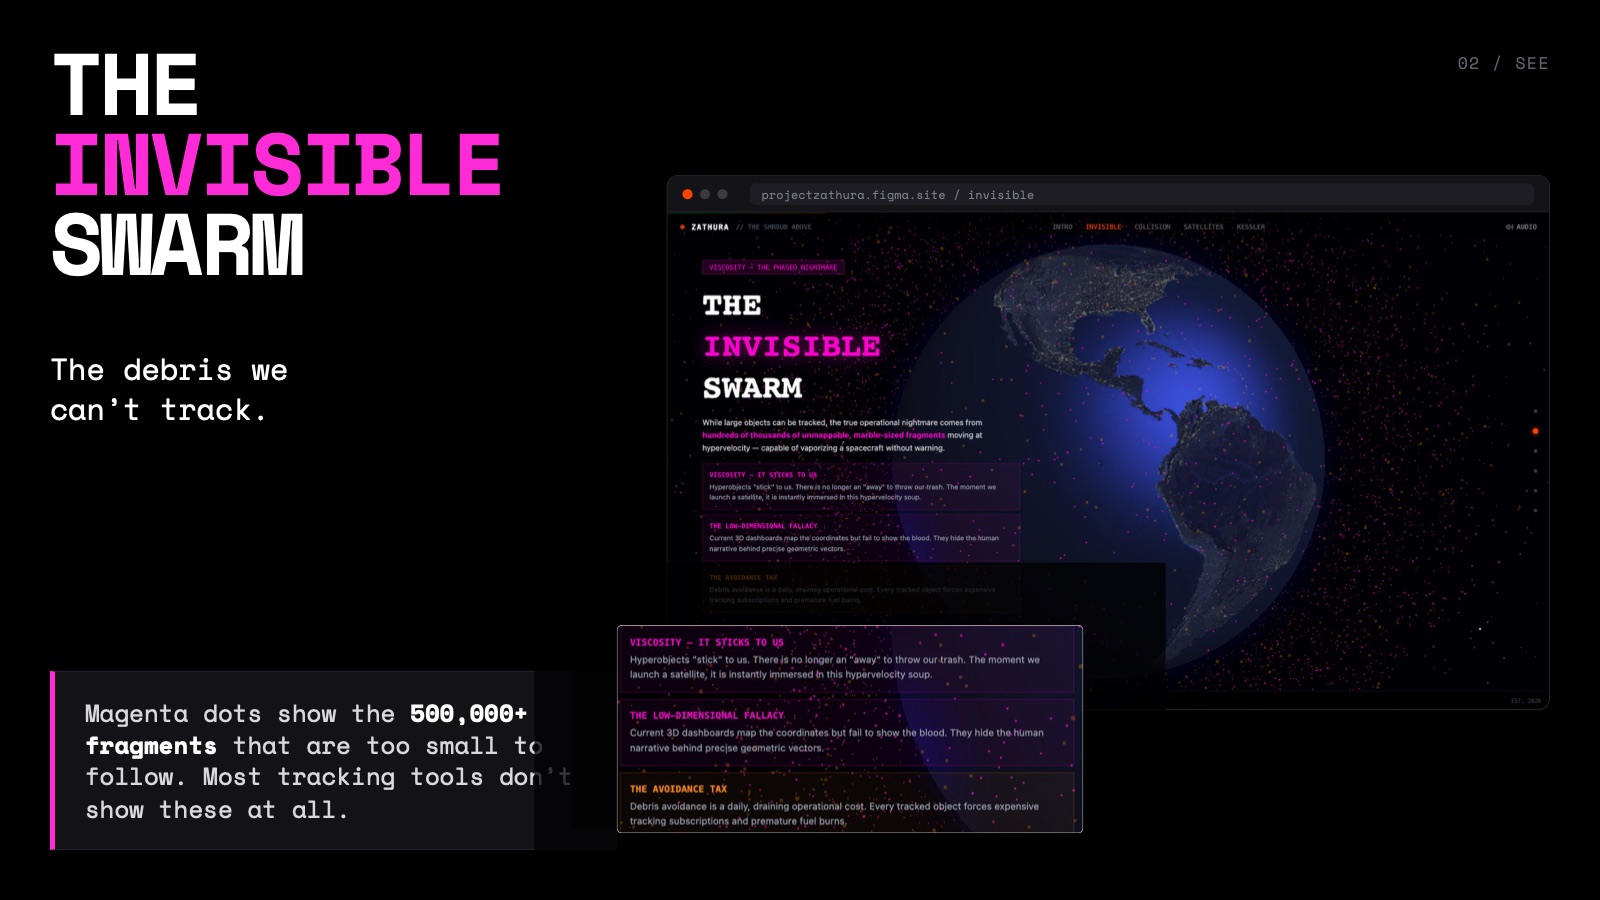
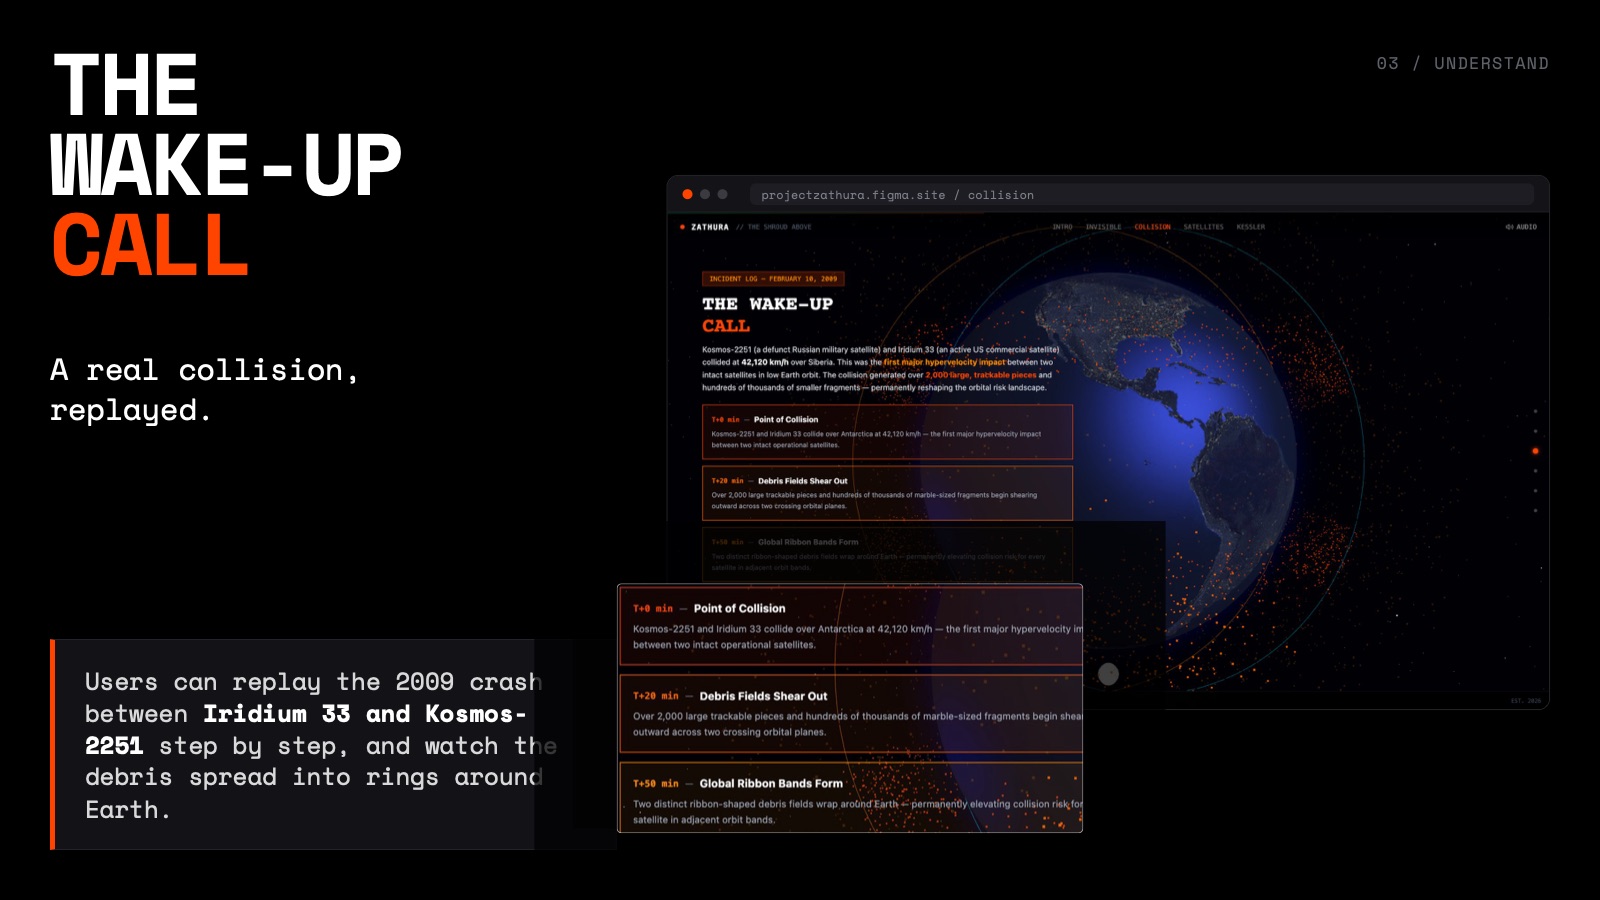
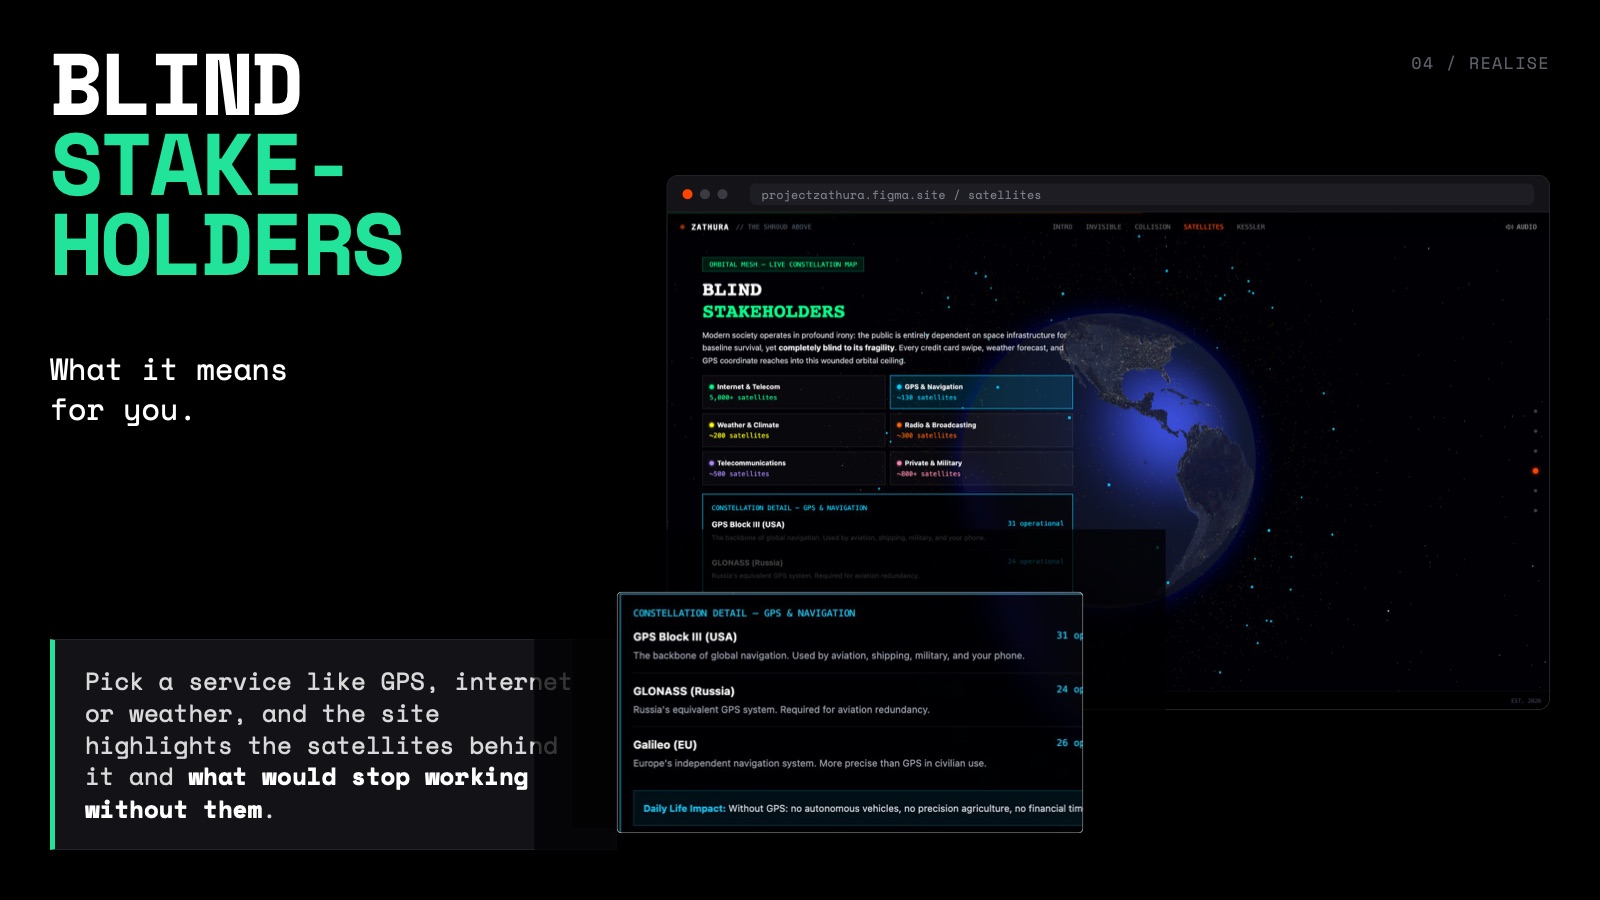
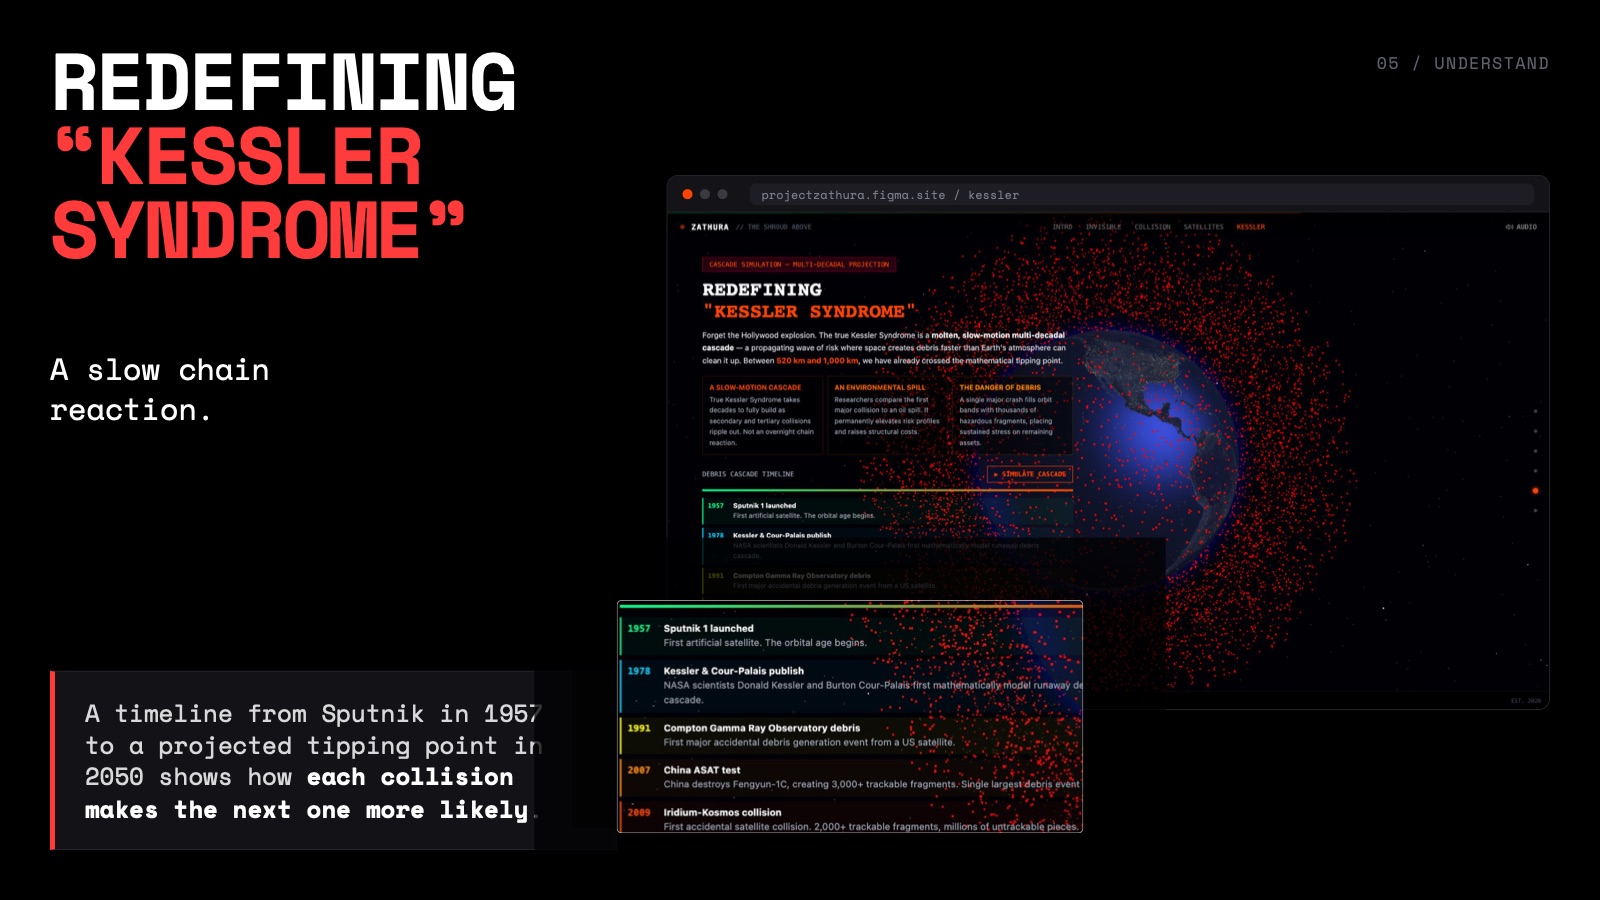
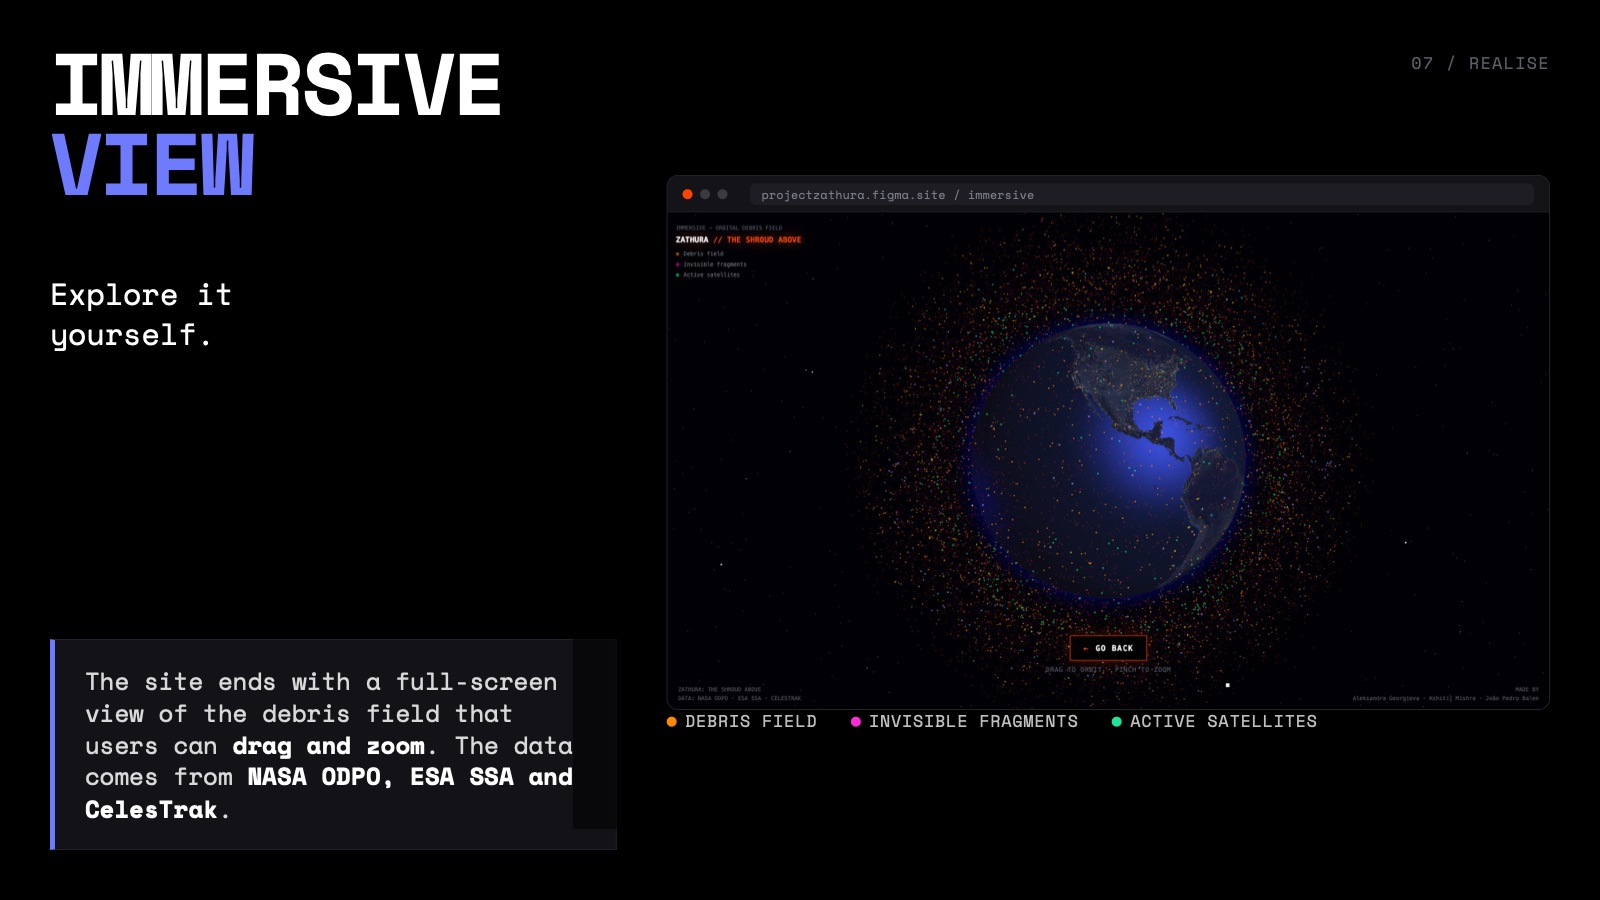
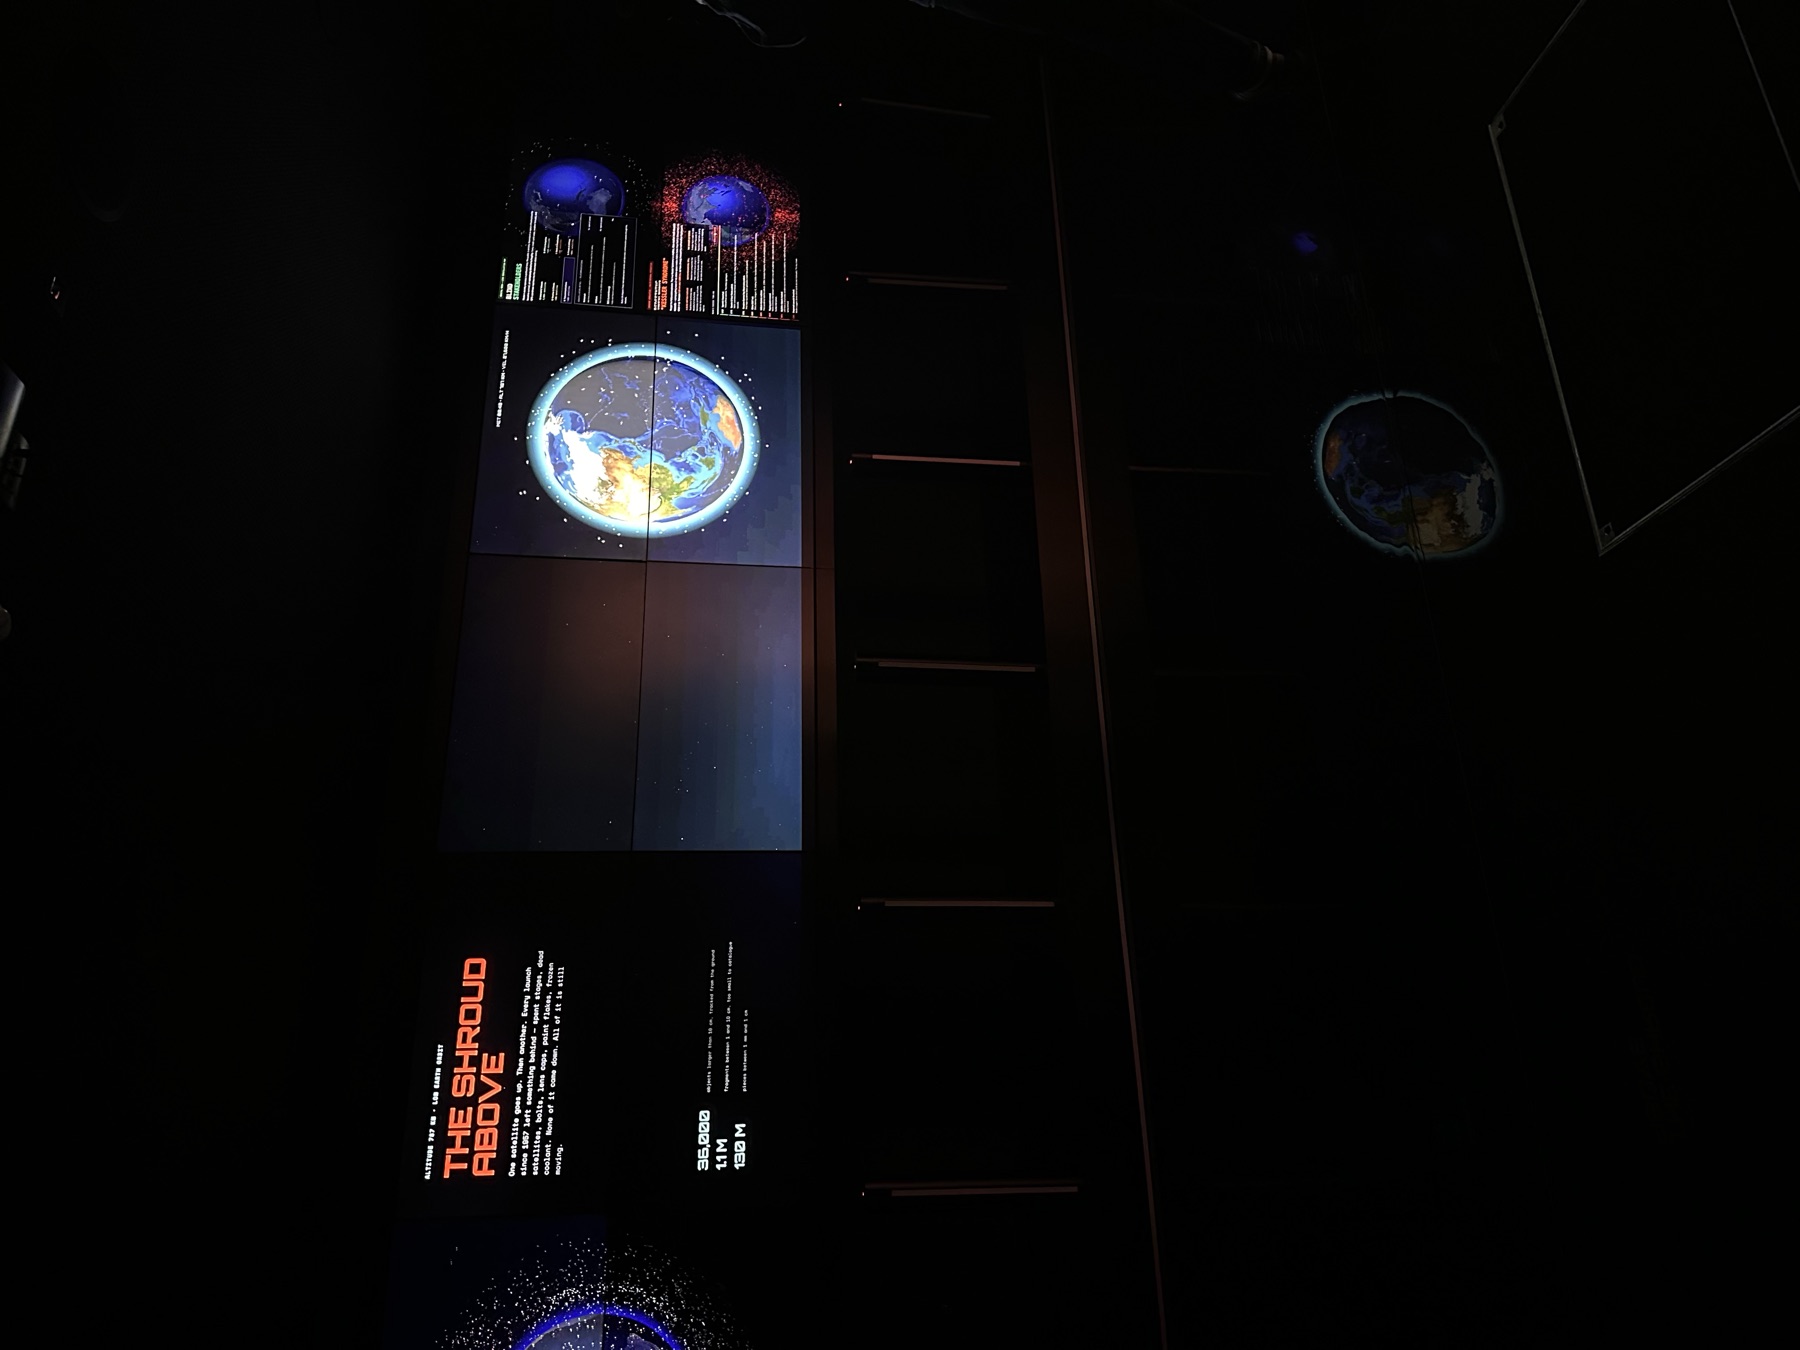
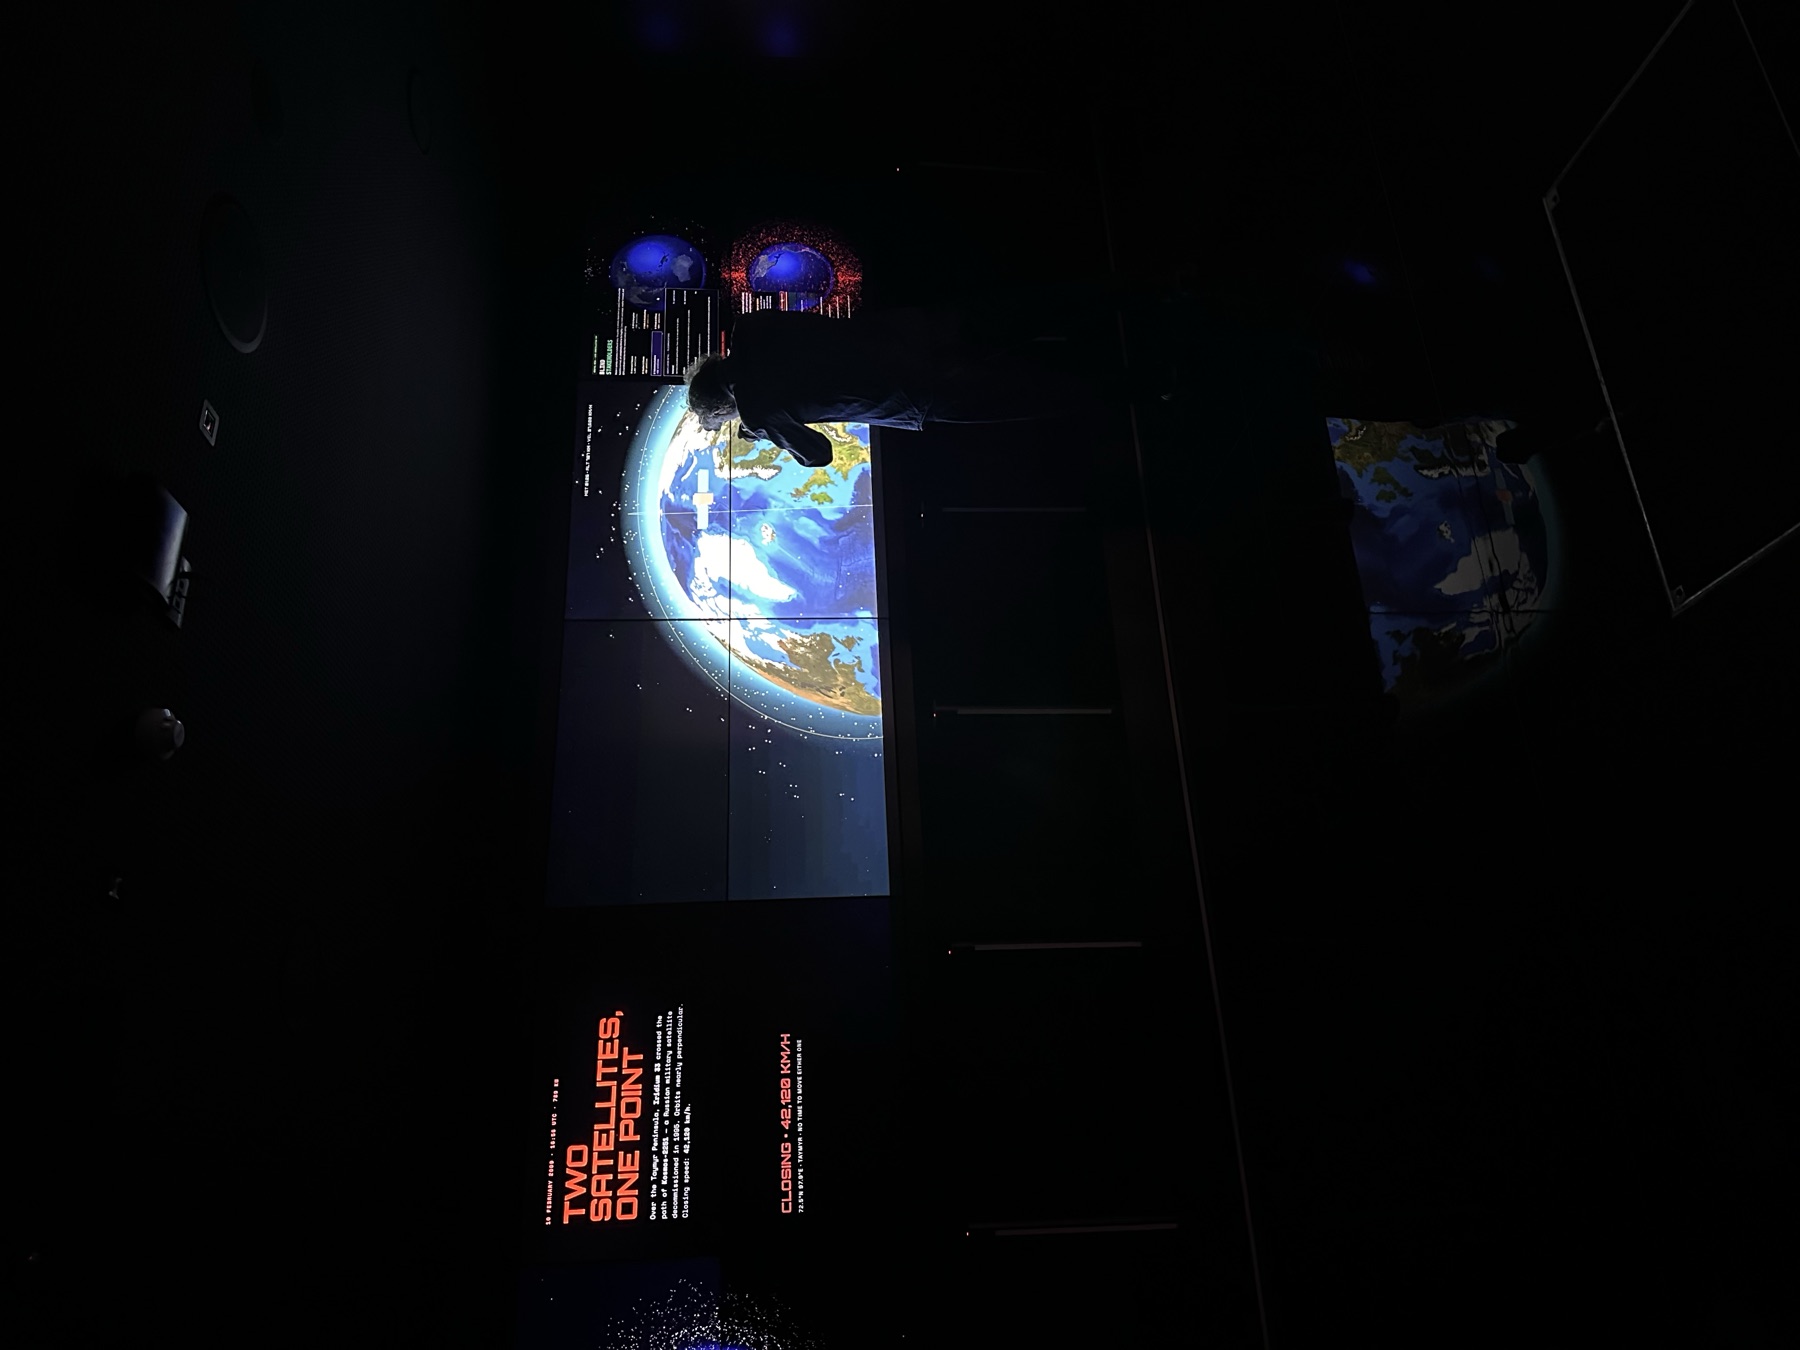
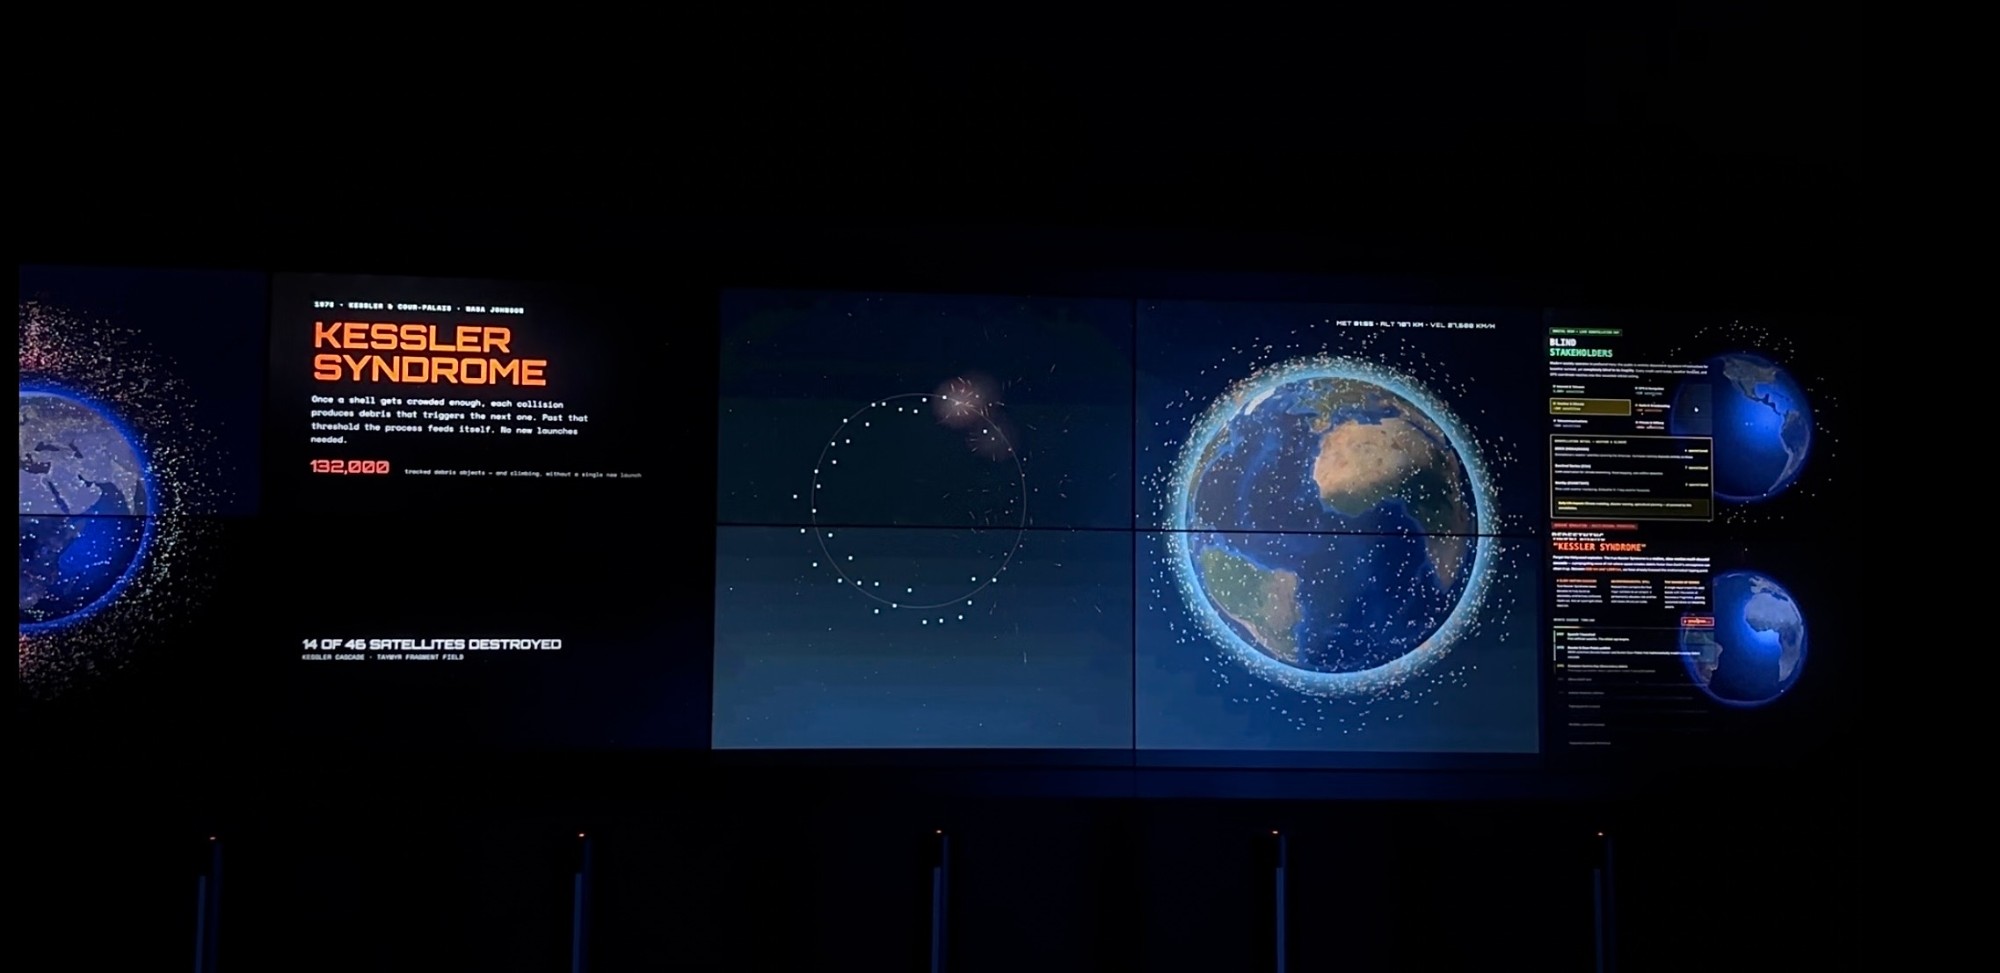
Zathura ran across STEP’s video wall as one continuous story. The website’s chapters sat side by side — the debris field, the 2009 collision replayed, the Kessler chain reaction, and Blind Stakeholders, which links satellites to the services people use every day. From a distance you get the scale; step closer and you get the detail.
How people joined in
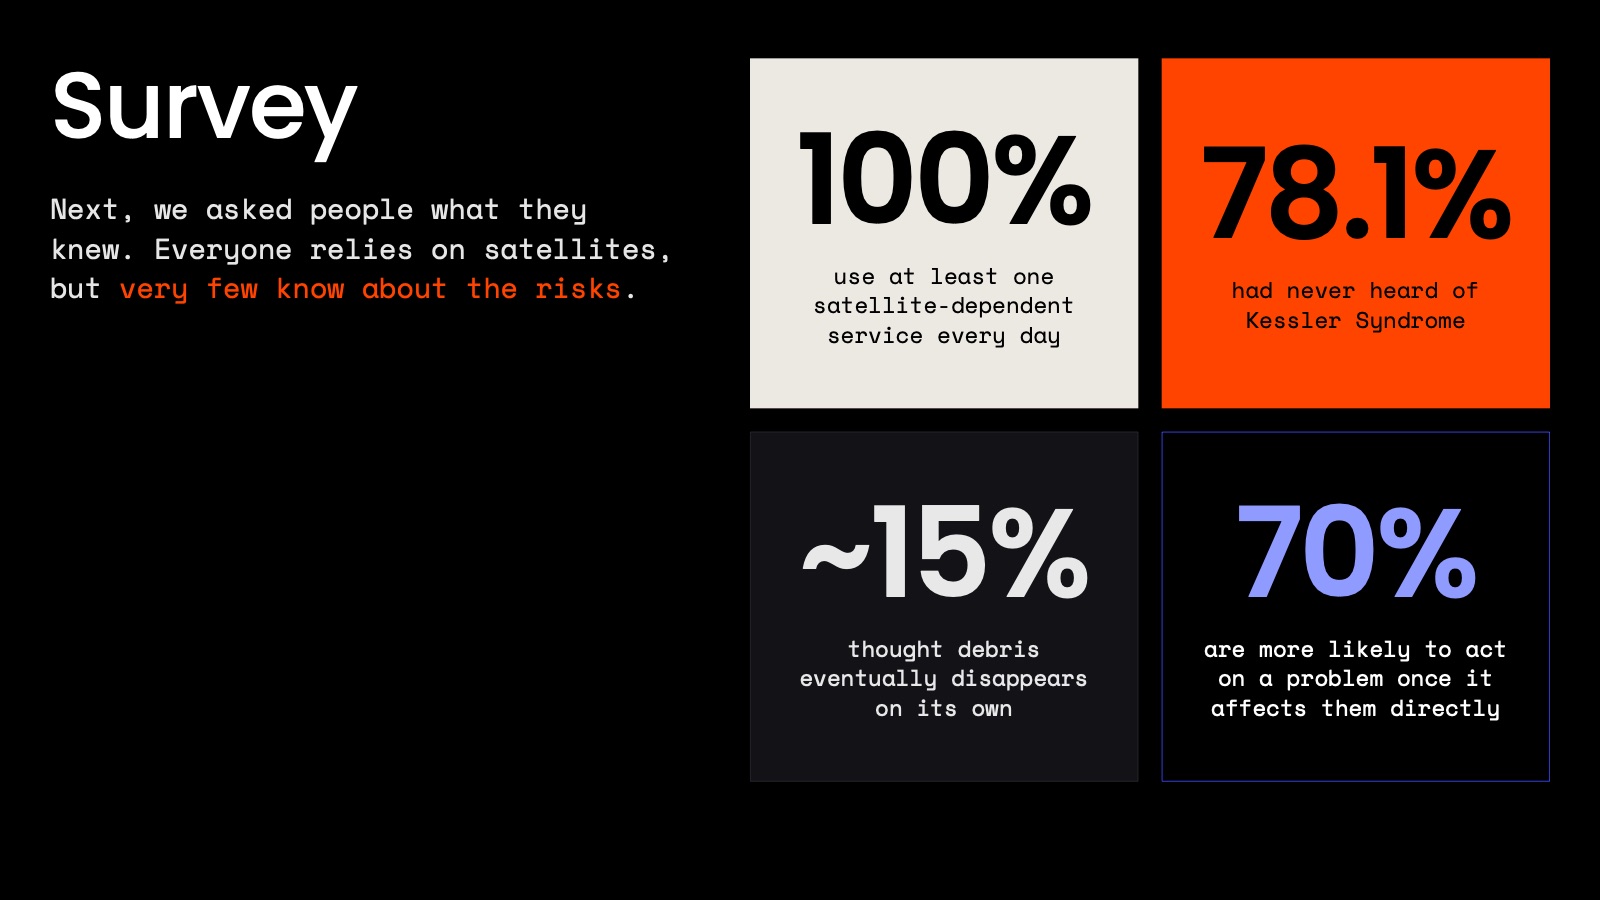
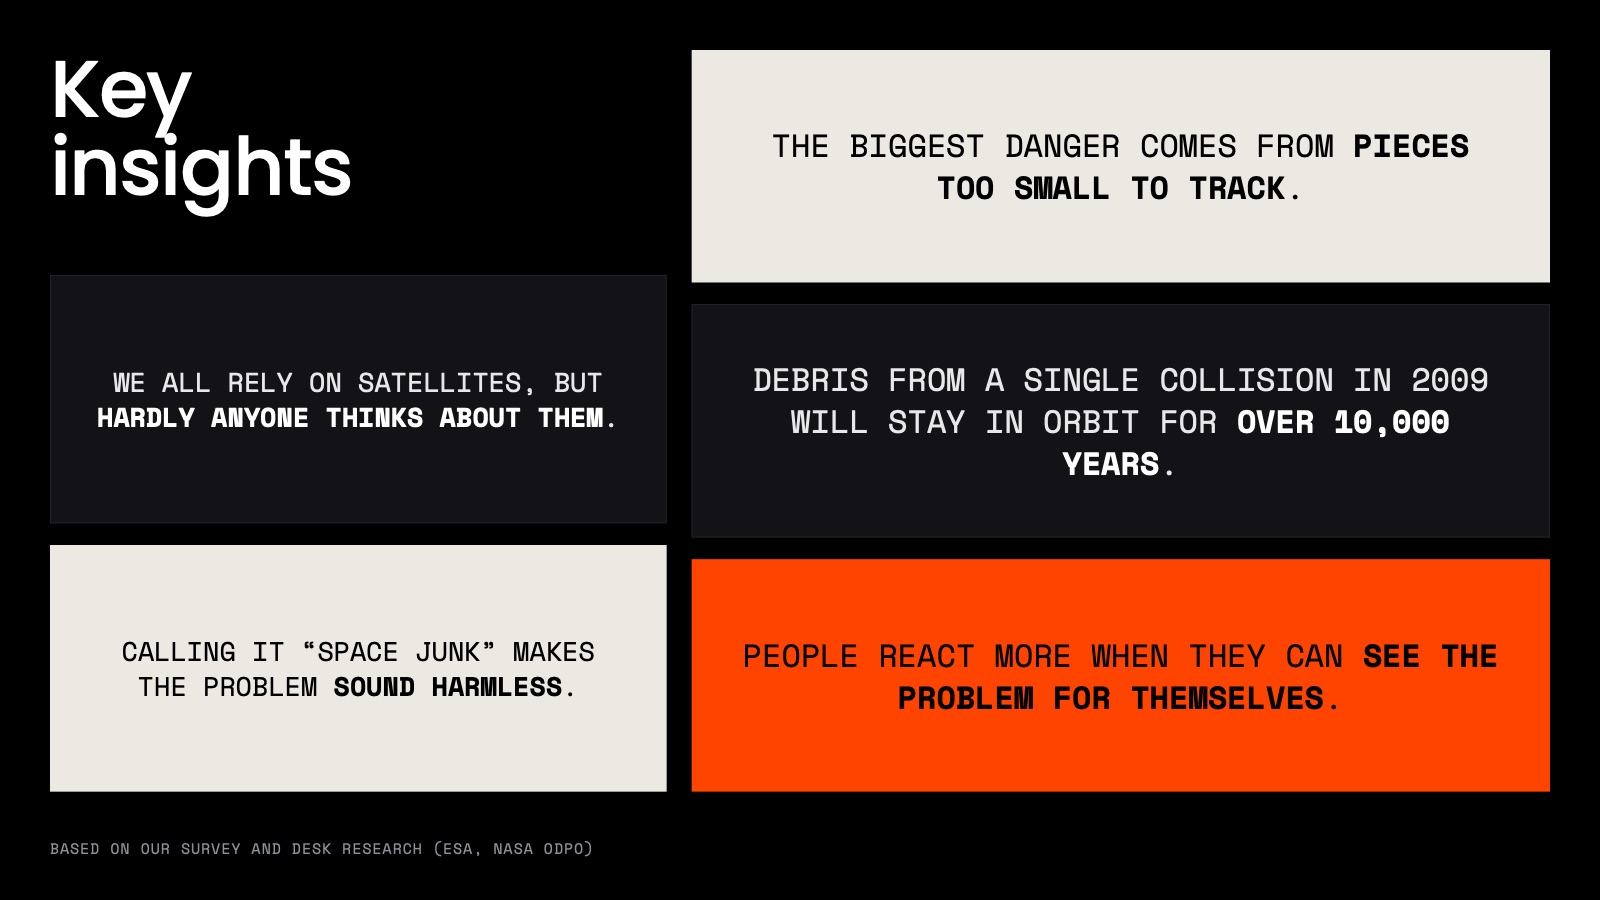
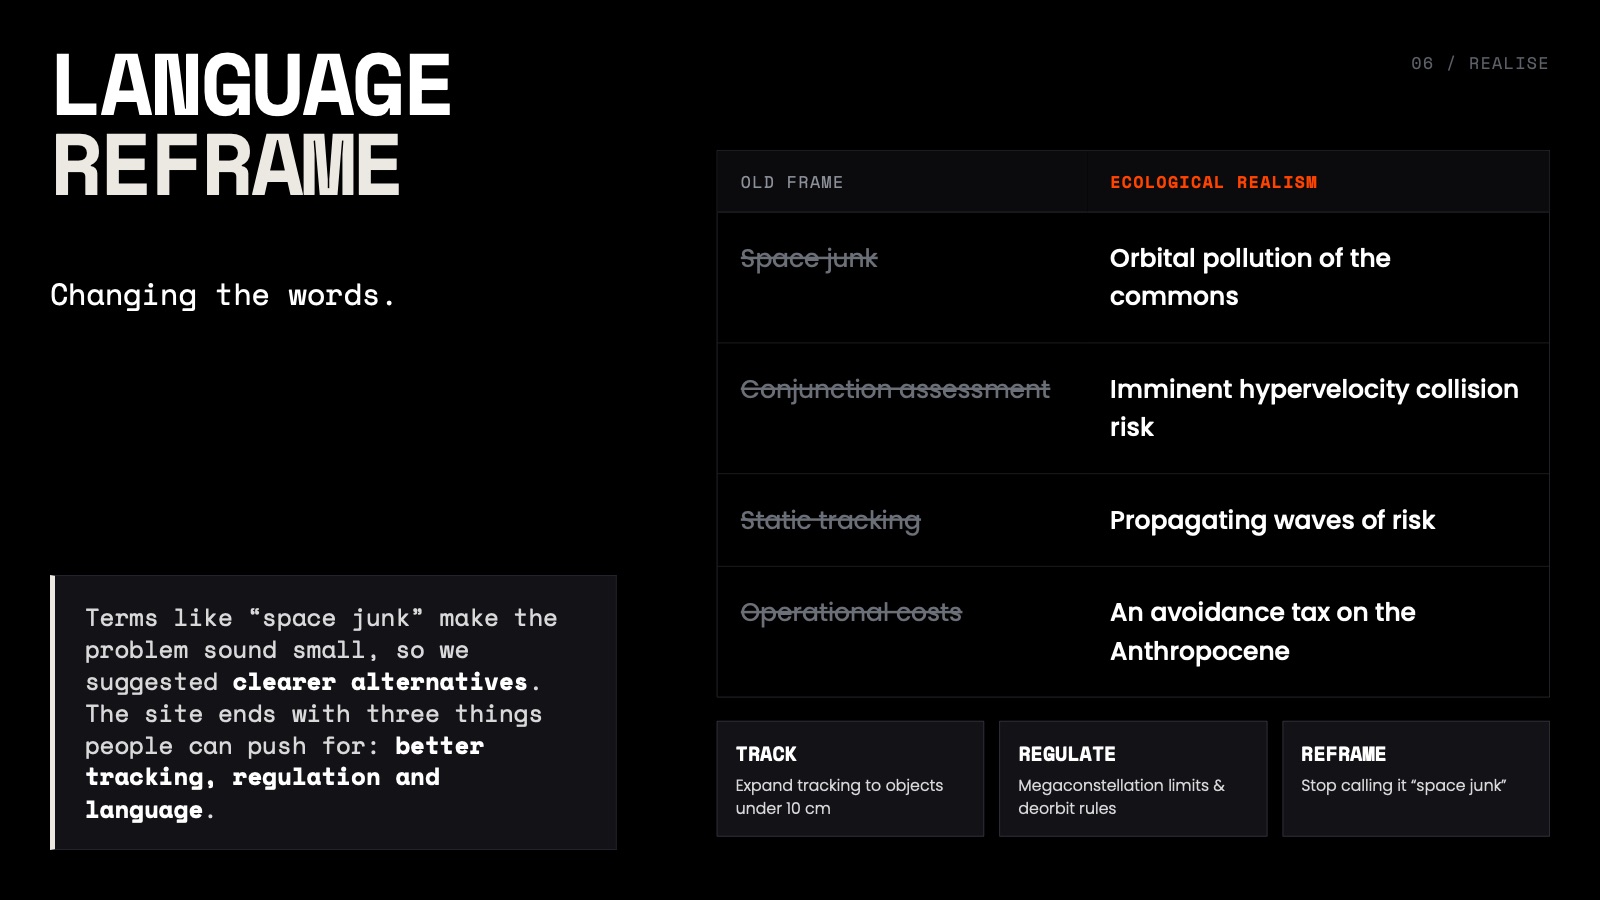
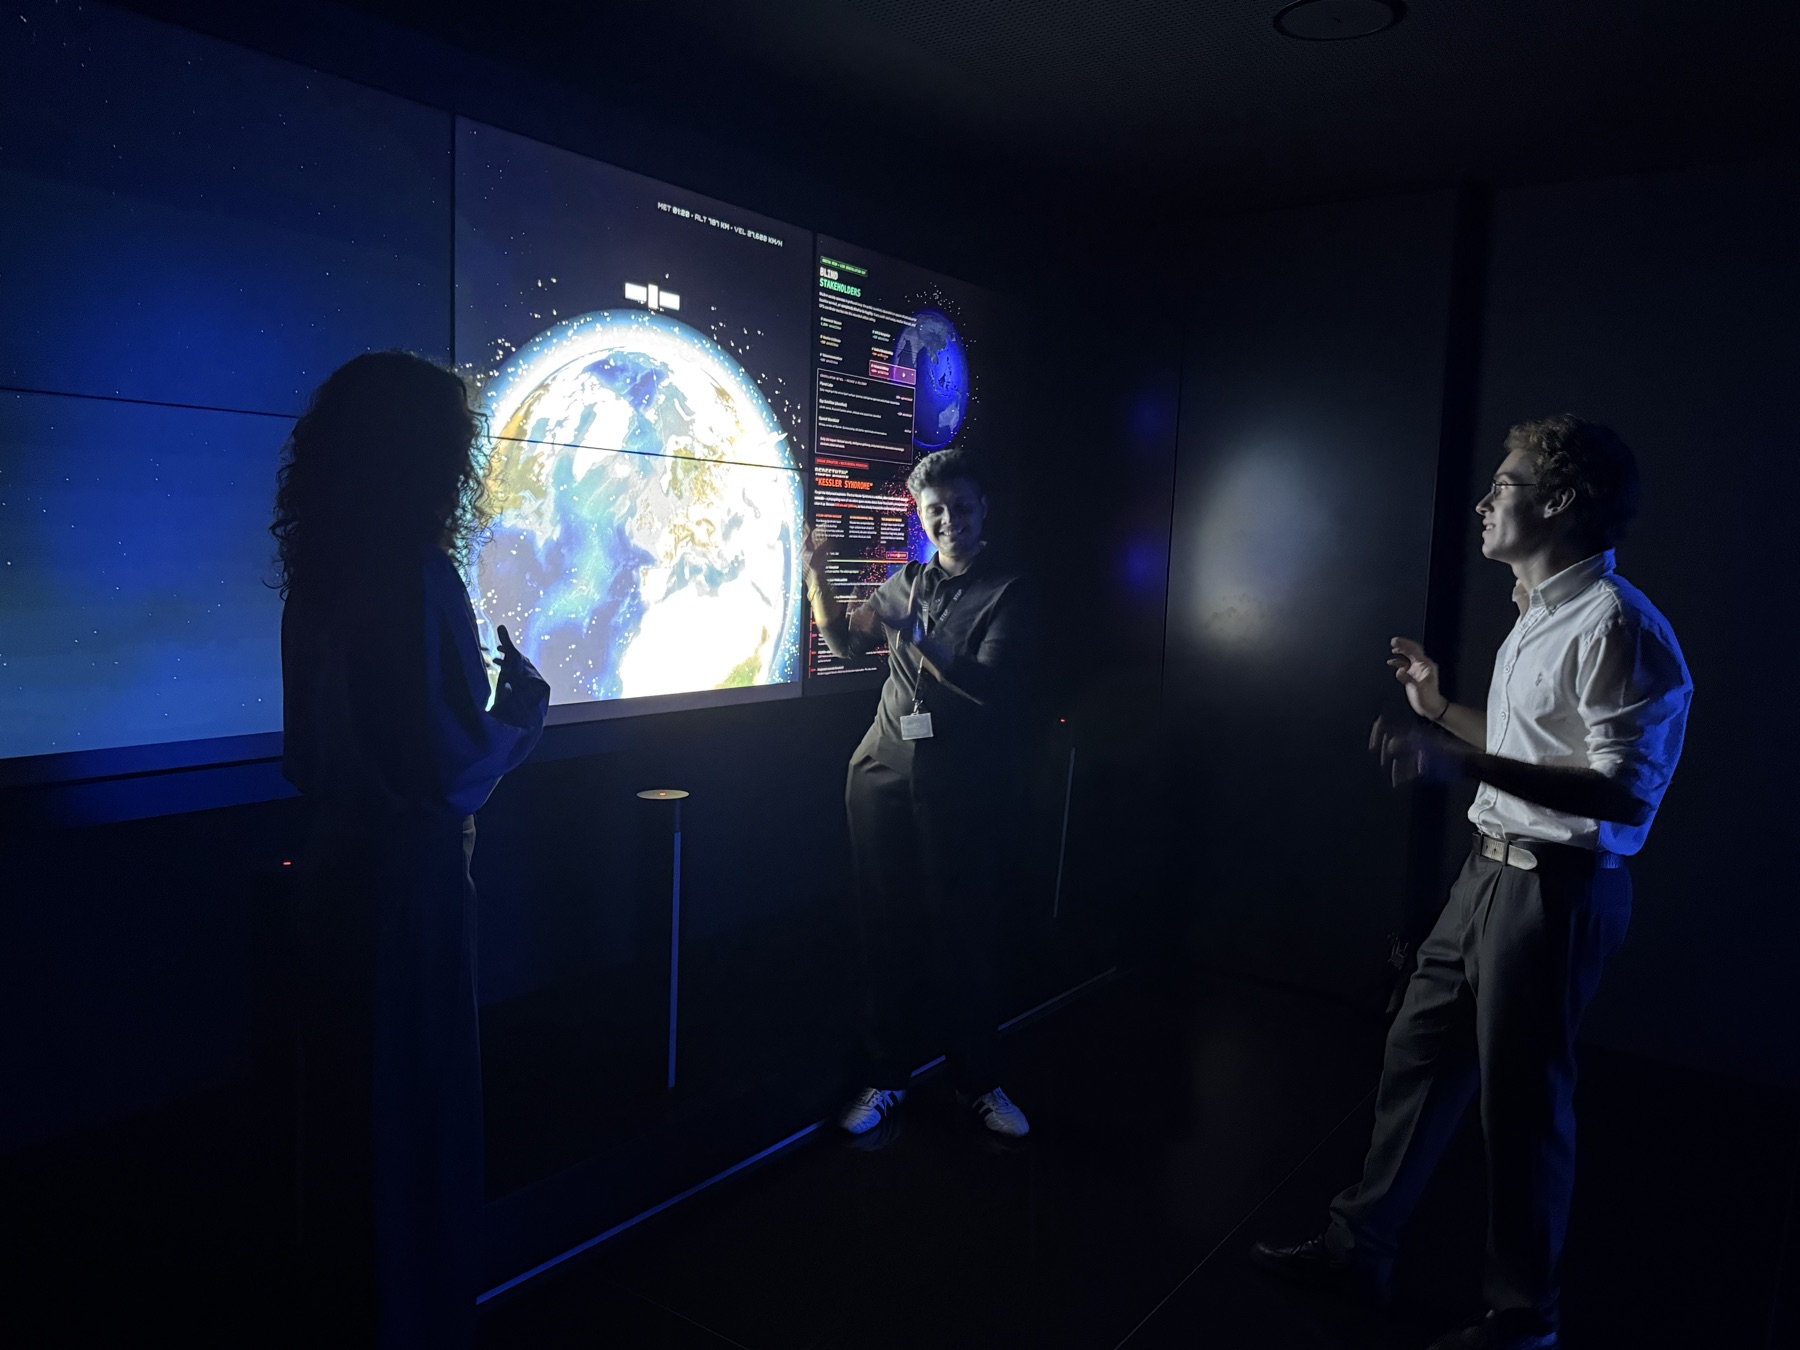
We stayed by the wall and talked people through it. The easiest way in was something everyone uses — maps, messages, the weather — and then showing the satellites behind it. Most visitors had never heard of Kessler Syndrome, so watching one collision spread into rings around Earth usually started the best conversations. We closed with a short talk on what can change: better tracking, regulation, and the words we use.
Curious about the full experience?
This is the loop exactly as it ran on the wall at STEP, start to finish — about three and a half minutes.